Megatrend · Climate Adaptation & Water
Before the storm ever hits, it's already run over your house ten thousand times
Every time an insurer prices a coastal home, or a reinsurer decides to take on hurricane risk for an entire Florida, there's an invisible "brain" behind it — a catastrophe model (cat model) that simulates tens of thousands of hurricanes, floods, and wildfires running across the real map, then answers with a number: "how much damage should we expect per year?" This lesson walks through how a cat model works, why this market is controlled by just two companies, and why a "brain" that sells nothing but data is one of the deepest-moated businesses in all of insurance.
01What it is
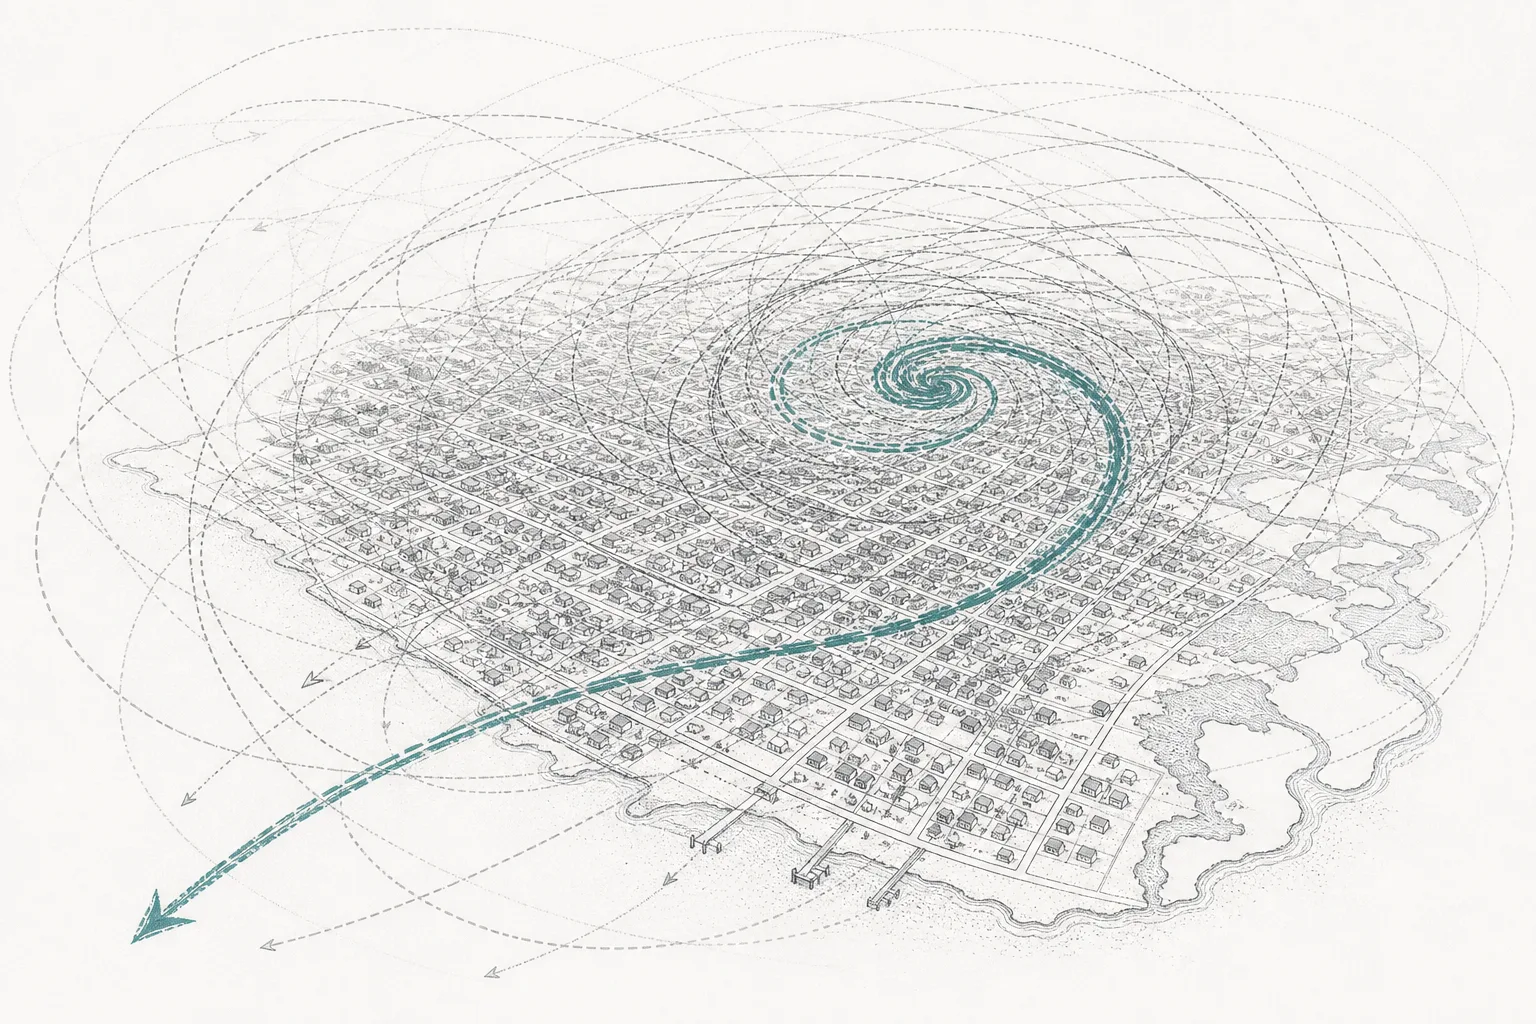
Picture a question that sounds simple but is very hard to answer: a single coastal home in Florida — how much should it pay in premium each year? You can't go by the past alone, because the biggest hurricane ever may not have happened in the 100 years of data you have — and you can't wait for it to actually happen before you set the price. The insurance industry's answer was to build a "simulated world" — letting hypothetical storms, floods, and wildfires run across the real map tens of thousands of times, then counting how much that house loses on average per year. That's the heart of this node.
This node is the business of the "brain" that assesses and prices catastrophe risk — companies that build catastrophe models (cat models for short) and climate-risk data. They don't carry a cent of the damage themselves. Instead they sell "answers" to insurers, reinsurers, and governments worldwide to decide how much to charge, how much risk to take, and where to build — or not build. It's the "data and models" layer that sits beneath the entire catastrophe-insurance world.
On the megatrend map, this node is a leaf at the end of a branch under Climate Risk Analytics & Insurance within the big trend Climate Adaptation & Water. It's the "brain" half of a pair; its sibling next door is Property/Casualty & Reinsurance Underwriting — the "wallet" that puts real money on the line to carry that risk. The two are inseparable, because whoever carries the risk always has to rely on whoever calculates it. This lesson focuses on the brain side — if you want to know who carries the money and how their profits run in cycles, follow the wallet side.
Catastrophe model (cat model) = disaster-simulation software that runs tens of thousands of hypothetical events to assess damage · AAL (Average Annual Loss) = the average damage expected per year over the long run — this number is the basis for setting premiums · PML (Probable Maximum Loss) = the damage in a worst-case scenario at a given probability level (say, an event that happens once every 250 years) — it tells you how much capital to reserve so you don't go under
02Why it matters — hundreds of billions in damage a year
The reason this group of "brains" matters to the world economy comes down to one undeniable fact: disasters keep getting more expensive, and the stakes get bigger every year. In 2025, the damage insurers had to pay worldwide was about $107 billion — the sixth year in a row that number topped $100 billion, becoming the industry's "new normal ceiling." And when you add up all economic losses (insured and uninsured), the number rises to the level of $300 billion a year.
When the stakes are this big, mispricing risk by even a little means billions of dollars vanish. That's why everyone has to rent the "brain" — insurers use cat models to set premiums, reinsurers use them to decide whether to take on big chunks of risk, regulators use them to check whether insurers have enough capital, and governments use them to plan for disasters. All of it leans on the same set of numbers coming out of just a handful of companies' models.
What makes the "brain" business more interesting than the size of its market is that it's a very deep moat. These models are embedded deep in how the whole industry works — insurers build their entire pricing systems, regulatory reporting, and reinsurance purchasing on top of one particular model's output. Switching models means rebuilding the whole company's pricing system. The result is steady, predictable subscription revenue — unlike the wallet side, whose profits swing with the disaster cycle.
03How it works (the disaster simulator)
A cat model isn't a magic box — it's a conveyor belt of 4 modules feeding into each other, turning "nature's chaos" into numbers you can price. Understand these four steps and you understand the whole business.
Step by step. (1) Hazard the model builds a "stochastic event set" — tens of thousands of hurricanes, earthquakes, and wildfires, each with its own track, intensity, and frequency, grounded in physics and historical statistics. (2) Exposure feeds in the data on "what's where" — where each house sits, how much it's worth, whether it's built of brick or wood, how many stories tall. Because the same peril does wildly different damage depending on what it hits.
(3) Vulnerability is the hardest part to copy — the "damage function" that says how many percent a house of this type is damaged by wind of this speed. That knowledge is built from decades of real claims data. (4) Financial converts the physical damage into money, then adds the policy terms (deductibles, payout caps, reinsurance contracts) to say "who pays how much." Finally you get a loss-distribution graph whose average is the AAL (used to set premiums) and whose right tail is the PML (used to set reserves) — the two numbers that turn the whole catastrophe-insurance world.
04How it connects in the ecosystem
This node is a "data layer" sitting beneath several lines of business — it feeds the numbers that others use to decide. Here are the key relationships.
- Feeds the "brain" straight to the underwriting side, P&C & Reinsurance Underwriting: this is the tightest relationship — the brain calculates the risk, the wallet takes that number to set premiums and decide what to accept. Without the model, a reinsurer can't even price the storm risk of an entire state
- Uses AI Tooling, Data & MLOps and satellite data as raw material: the new generation of models uses machine learning to capture the "secondary perils" that pure physics struggles with, and pulls in vast satellite imagery and sensor data to make exposure more accurate — the better the data, the more valuable the model
- Is the measuring stick for the whole Climate Adaptation & Water trend: every adaptation investment (building a flood barrier, deploying a wildfire-defense system) needs a number for "how much did the risk drop" — and the cat model is the one that answers. That makes it the yardstick for the entire trend
- Drives modern finance: once risk is measured in precise numbers, it gets turned into tradable financial assets — like cat bonds (catastrophe bonds) and parametric insurance that pays out automatically when disaster data hits a threshold — linking through to Digital Finance & Tokenization
05Where it stands now
The most astonishing thing about this industry is its concentration — the catastrophe models the whole world uses to price risk come mainly from just two companies. It's nearly a "duopoly" (a two-giant market): on one side is Verisk, through its Extreme Event Solutions unit, which absorbed AIR Worldwide, the pioneer that built the first catastrophe model back in 1987. On the other is Moody's RMS — Moody's spent $2 billion to buy RMS in 2021. Almost every insurer uses one of these two models as its standard, with CoreLogic as a smaller third player.
The tailwind right now comes from disasters that are getting harder to simulate. With 92% of 2025's losses coming from "secondary perils" like wildfires and floods — which old-style models capture less accurately than hurricanes — the company that can model secondary perils more accurately gains an enormous edge. Verisk brought in about $3.05–3.08 billion in total company revenue in 2025, with the catastrophe-model unit one of its main growth engines, while Moody's is racing to embed AI into the RMS platform specifically to handle secondary perils.
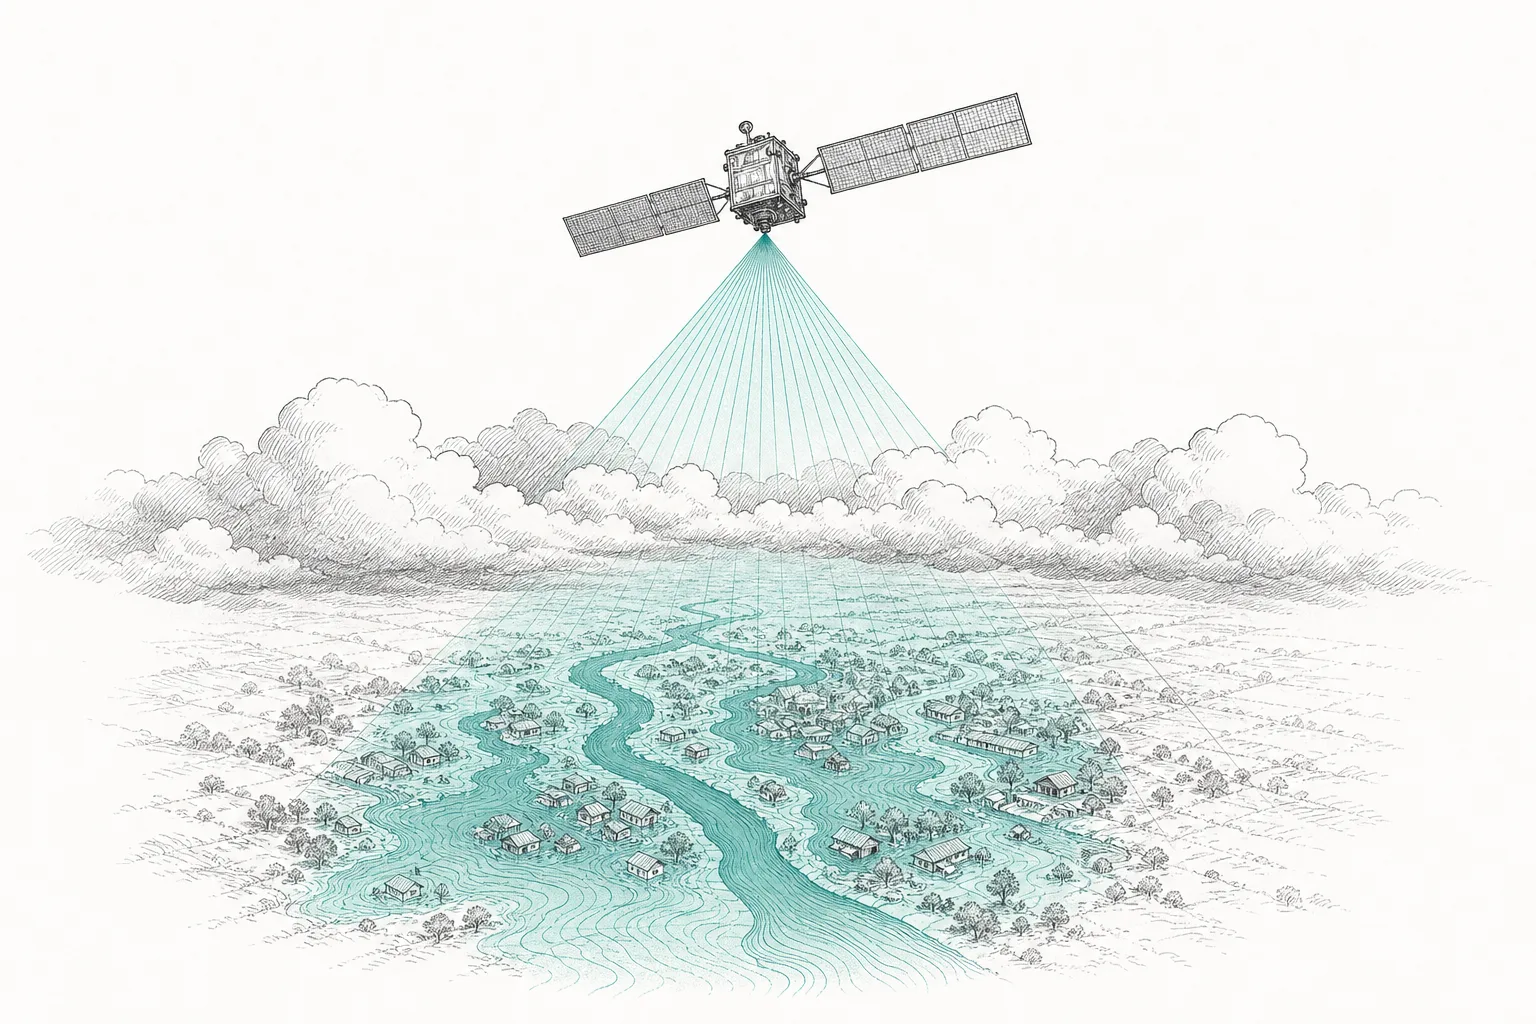
The other thing shaking up the board is a wave of specialized newcomers, most of them still private companies not on the stock market — Jupiter Intelligence (founded 2016) focuses on forward-looking climate-risk analysis, ICEYE uses radar satellites (SAR) to measure flooding in real time through cloud cover, feeding data to parametric insurance (in late 2025 it partnered with a Munich Re unit), and CoreLogic is strong on property data — these players don't compete head-on with the two giants, but fill the gaps where the old models are weak.
06The road ahead
The first direction is models that "look ahead," not just back (climate-conditioned). Cat models were traditionally built mainly from the statistics of past events. But as the climate changes fast, the past is becoming a poorer stand-in for the future. So both Verisk and Moody's RMS are racing to build models that adjust to future warming scenarios — whoever can simulate "a hotter world" more accurately gains a lasting edge, because customers will pay more for numbers they can trust.
The second direction is conquering "secondary perils" with AI and high-resolution data. Wildfires, flash floods, and thunderstorms are the hardest perils to simulate, because they hinge on messy local factors (fuel, wind, terrain). This is the battlefield where machine learning and high-resolution satellite data are changing the game — and the opening that lets specialized players like Jupiter and ICEYE grow without competing head-on with the two giants.
The third direction is new markets outside the insurance world. As climate risk touches everyone, the "brain's" customers expand far beyond insurers — banks have to assess climate risk in their loan portfolios, real-estate funds need to know which buildings are flood-prone, big companies have to disclose risk to investors under new rules. All of this is a new block of demand that's making the climate-risk data market grow faster than the traditional insurance market.
07Challenges & risks
A business that sounds like it's perfectly positioned — "the hotter the world, the more it earns" — actually carries several layers of deeply embedded risk.
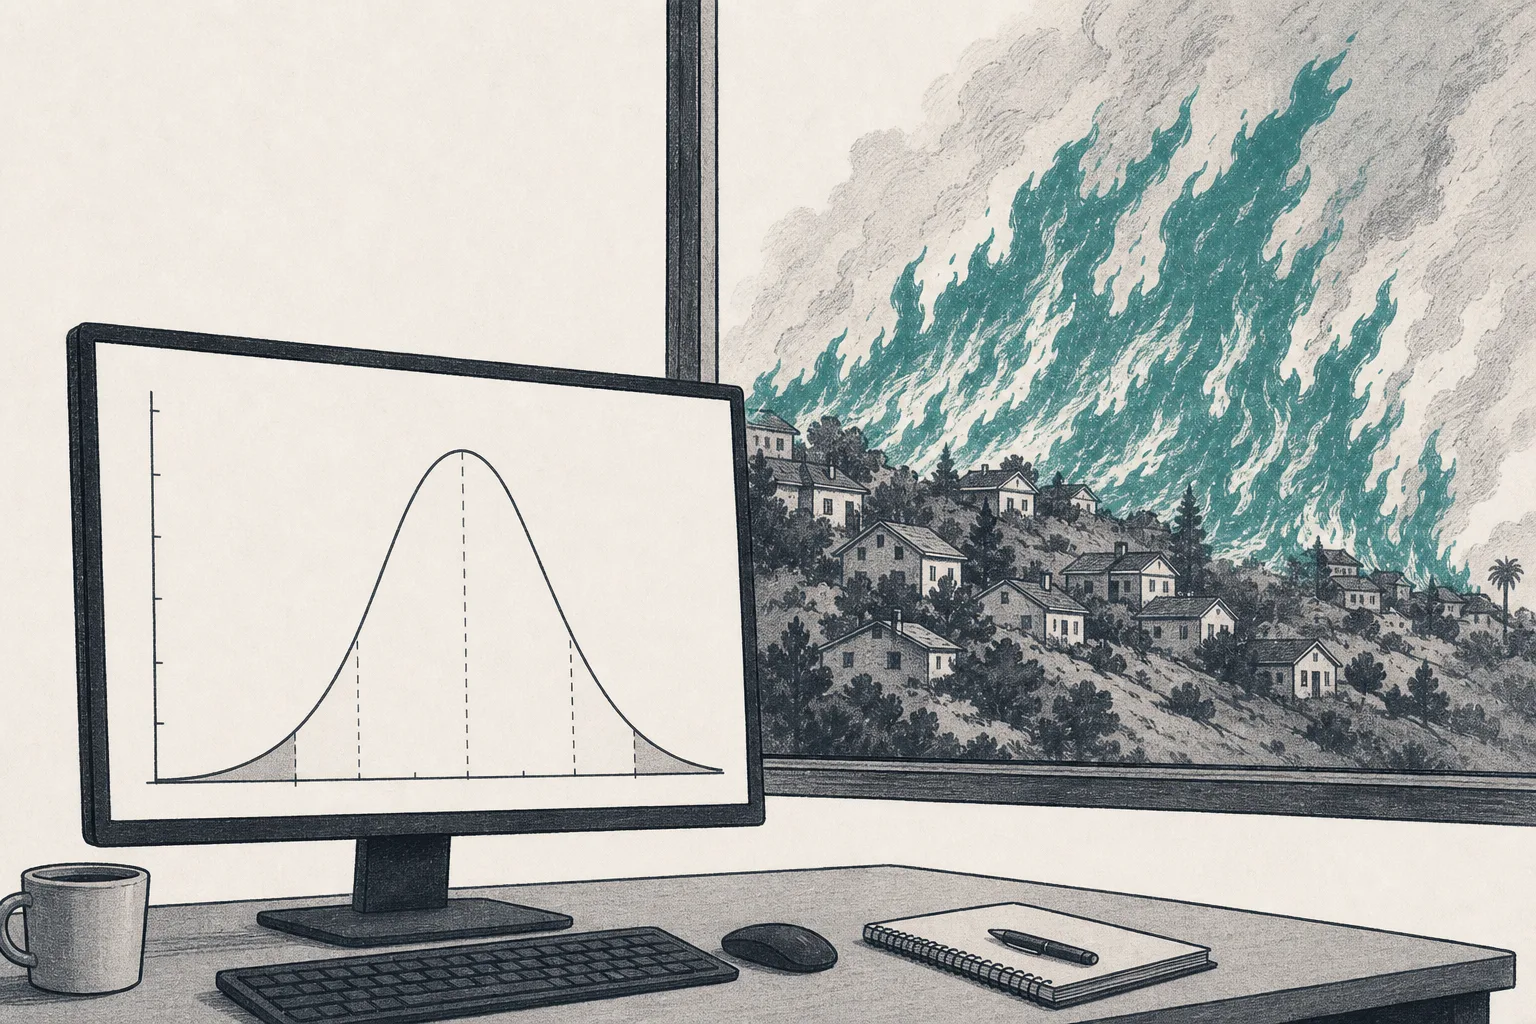
The first and biggest risk is "the model is wrong" (model risk). Models are good at clearly simulable perils (hurricanes, earthquakes), but with secondary perils like wildfires, their accuracy is much lower. The LA wildfires in early 2025, which caused about $40 billion in insured damage — becoming the most expensive wildfire in history — were an industry-shaking lesson that many models had underestimated "the risk in the wildland-urban interface." When a model misses, the carrier (the reinsurer) loses heavily, and the modeler loses credibility — which is the only asset they have.
The second risk is competition and the "black box". When the market is controlled by two giants, some customers start wanting alternatives and transparency — giving rise to a wave of open models and specialized players that challenge why you'd trust a "black box" you can't audit. At the same time, AI is lowering the cost of building a model, opening the door for more newcomers. The moat that used to be deep may not be as deep as before.
The third risk is data quality and gaps. A model is only as accurate as the data you feed it — in emerging markets where property data and disaster history are scarce, the model is weak to match. And when the climate changes faster than past data can keep up, uncertainty rises. "Overconfidence in a number with decimal places" may be more dangerous than admitting you don't know.
In short: this node is the quietest yet most influential layer of the catastrophe-insurance world — it turns "nature's chaos" into the numbers the whole world uses to decide how much to charge and where to build. The more expensive and harder-to-simulate disasters become, the more valuable the "brain" that can calculate them most accurately.