Megatrend · Climate Adaptation & Water
When disasters cost more every year, who gets paid from the swelling "risk"?
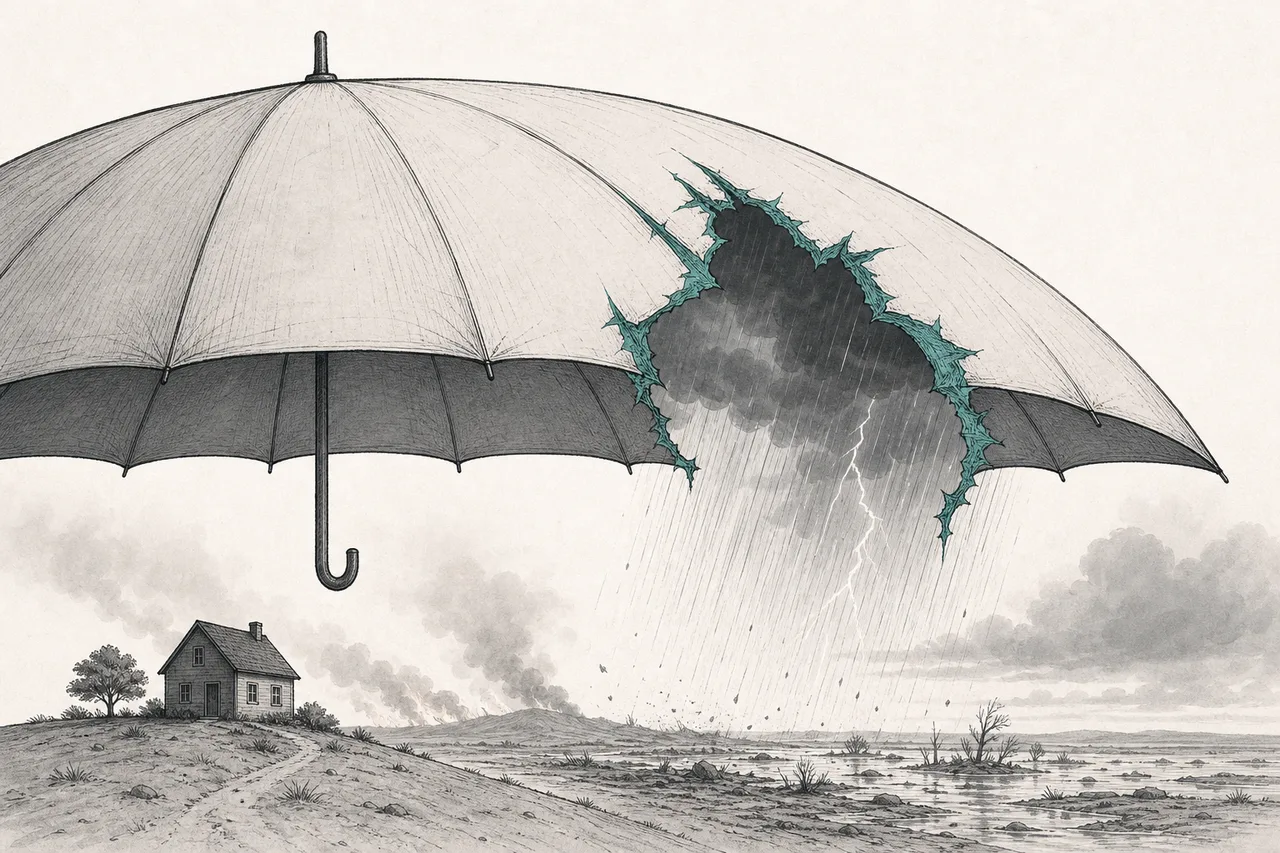
Every time wildfires burn Los Angeles, floods hit Europe, or storms slam America, the world loses hundreds of billions of dollars — and two kinds of businesses "take on" that damage directly: the people who calculate and price the risk (catastrophe-model firms) and the people who carry that risk on their books (insurers and reinsurers). This lesson looks at why "climate risk" became a sellable product, why a hotter world leaves more people without insurance, and why a "protection gap" worth hundreds of billions is both an opportunity and a warning.
01What it is (two businesses, one risk)
Picture a January 2025 morning when wildfires swept through the wealthy neighborhoods of Los Angeles. The insured losses came to roughly $40 billion from a single event — the most expensive wildfire in history. The obvious question: who pays for that? And before that, who decided what that house "should pay in premiums"? This node is about the two groups behind that question.
The first group is the "brains" — companies that build catastrophe models (catastrophe model) and climate-risk data. They don't carry the losses; they sell the "answer" to how likely a given house or city is to be hit by storms, floods, or wildfires, and what it should cost. The second group is the "wallets" — insurers and reinsurers (reinsurer = insurance for insurance companies) that put real money down to take that risk onto their own books in exchange for premiums.
Reinsurance = "insurance for insurance companies." When a disaster is too big for one insurer to absorb, it buys cover from a global reinsurer (Munich Re, Swiss Re) to spread the risk · Protection gap = the slice of losses that insurance doesn't cover at all, which property owners or governments must bear themselves — that number is the heart of this whole lesson.
On the megatrend map, this node is a sub-theme under Climate Adaptation & Water. Its definition is short but complete: "modeling, pricing, and bearing the physical risk from climate." It splits into 2 sub-categories that this lesson tells side by side — Catastrophe & Climate Risk Analytics (the brains) and Property/Casualty & Reinsurance Underwriting (the wallets). They're different businesses, but inseparable — because the side bearing the risk always leans on the side calculating it.
02Why it matters — disasters cost more every year
What makes this business interesting as a "climate-adaptation investment" comes down to one undeniable fact: disasters keep getting more expensive. In 2025, global economic losses from natural disasters ran about $220 billion, of which only ~$107 billion was insured — and this was the sixth straight year insured losses topped $100 billion, now the industry's "new normal ceiling."
More important than any single year's number is the "trend." Swiss Re estimates insured losses are growing 5–7% a year over the long run — faster than the world economy. It's not just that the weather is getting more extreme; it's also that people and assets keep concentrating in high-risk areas (coastlines, the wildland-urban interface).
When losses get more expensive, they create a clear "money cycle": risk rises → it has to be calculated more precisely (good for the brains) → insurers raise premiums and reinsurance prices climb (good for the wallets in a hard market). But there's a dark side too: the pricier premiums get, the more people can't afford them or get refused, which widens the protection gap — Swiss Re puts the global natural-disaster gap at roughly $424 billion.
03How it works — from risk, to price, to gap
The heart of the whole node lives in a four-stage mechanism that feeds one into the next like a conveyor belt. Grasp this belt and you grasp the whole lesson.
Step by step. Stage 1 A hotter world makes certain hazards more frequent and more intense — especially secondary perils (secondary hazards) like wildfires, flash floods, and severe thunderstorms. In 2025 these secondary perils drove 92% of all insured losses, the highest share on record (in contrast to primary perils like a big landfalling hurricane, which were quiet in the US that year).
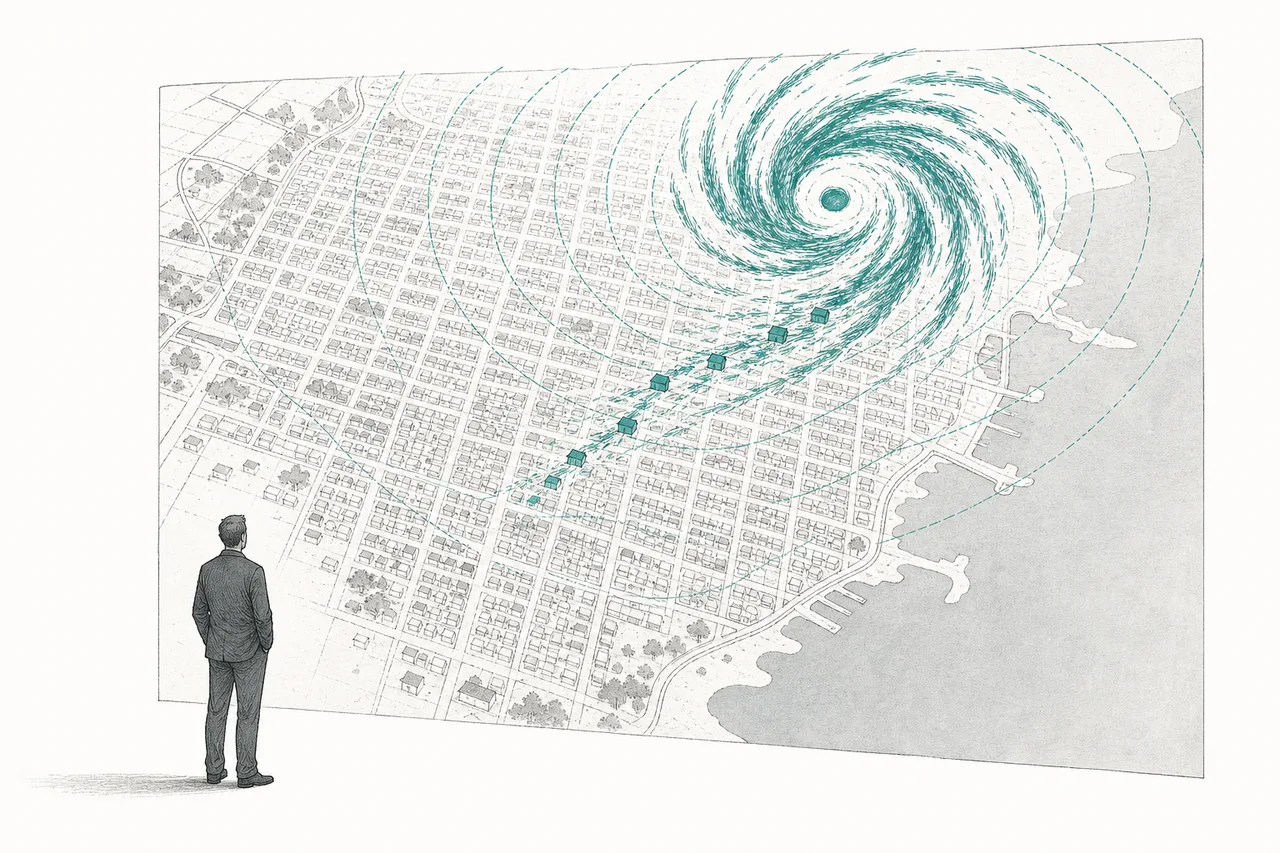
Stage 2 Catastrophe-model firms take these hazards and "simulate" them — running tens of thousands of storms across a real map to answer how much damage each house is likely to take. Stage 3 Insurers use that answer to set premiums, decide whether to take a risk or refuse it, and buy reinsurance to cap the big chunks. Stage 4 When risk gets so high that premiums get too expensive, some people go uninsured and some areas get refused — so the gap widens. That's both a new opportunity (markets no one yet covers) and a systemic risk (the burden falls on governments and citizens).
04A look at the 2 sub-categories: the "brains" and the "wallets"
The whole node splits into two sub-categories you have to understand together, because they're two sides of one coin.
Sub-category 1 — Catastrophe & Climate Risk Analytics (the brains)
This is the "sell knowledge" business — building the models and data that say where the risk is and what it costs. What makes it a great business is that it's a "duopoly" (a market with just two big players): on one side is Verisk, through its Extreme Event Solutions unit (which absorbed AIR Worldwide, the catastrophe-modeling pioneer founded back in 1987); on the other is Moody's RMS (Moody's bought RMS in 2021 for $2 billion). Nearly every insurer has to use one of these two as its standard for pricing and buying reinsurance.
Because these models are baked so deep into how the whole industry works (switching models means rebuilding your entire pricing system), they have a very deep "moat" and predictable subscription revenue. The overall climate-risk data market is still small but growing fast — mid-range estimates see it going from roughly $16 billion in 2026 to ~$79 billion by 2035 (about 17–19% annual growth), though the figures vary a lot depending on how each firm counts.
Sub-category 2 — Property/Casualty & Reinsurance Underwriting (the wallets)
This is the "carry the risk" business — putting real money down to pay out if a house is destroyed. The main cast has three layers: property & casualty insurers (P&C insurers like Chubb and Travelers) that sell policies straight to consumers; global reinsurers (Munich Re, Swiss Re, Hannover Re) that take on the big chunks of risk one level up; and brokers (Aon, Marsh McLennan) that act as the middlemen matching risk to capital.
The heart of this group's business is the phrase "hard vs soft market" (hard vs soft market). When disasters stay expensive for years (2022–2023), reinsurers jack up their underwriting prices hard — a profitable "hard market." But when capital floods back in, competition pushes prices down: catastrophe-reinsurance pricing (Global Property Cat ROL) fell ~12% at the January 2026 renewal, entering a "softening market" — though still about 38% above the 2017 floor. This is the "cycle" investors have to learn to read.
The simple takeaway: the "brains" sell knowledge for steady profit and a deep moat, while the "wallets" carry real risk so their profit is cyclical — but both benefit from the same trend of pricier disasters.
05How it connects in the ecosystem
This node sits at an interesting crossroads of several megatrends:
- Acts as the "risk-measuring brain" for all of Climate Adaptation & Water: every adaptation investment (building flood dams, installing wildfire-defense systems) needs a number for "how much does risk go down" — and the catastrophe model is what answers that. It also links directly to siblings like Drought, Wildfire & Flood Resilience
- Drives Digital Finance & Tokenization: climate risk is being turned into tradable financial assets, like cat bonds (catastrophe bonds) and parametric insurance that pays out automatically off data — the insurance world and the capital-markets world are fusing
- Relies on Critical Materials & Supply Chain and satellite data: more accurate models need vast amounts of imagery and sensor data
- Ties into Aging Population: an aging society and the concentration of wealth in high-risk areas (beachfront second homes) keep raising the value of the assets that need protecting
The deepest link is the one to finance, because the essence of this business is "turning physical risk into a financial product." When traditional insurance can't absorb it anymore, the capital markets (funds, pensions) step in to take the risk via cat bonds instead — letting California wildfire risk end up inside investment portfolios all over the world.
06Where it stands now + the real players
Both sides are in different rhythms right now. The wallet side (insurance & reinsurance) just came off a golden year — Europe's three big reinsurers (Munich Re, Swiss Re, Hannover Re) each raised their 2025 profit targets by roughly 20% on better underwriting results. But the "market starting to soften" signals in 2026 say the peak-profit window may be passing. The brain side (risk analytics) grows more steadily — Verisk posted $3.07 billion in total 2025 revenue (up ~7%), with insurance still its core.
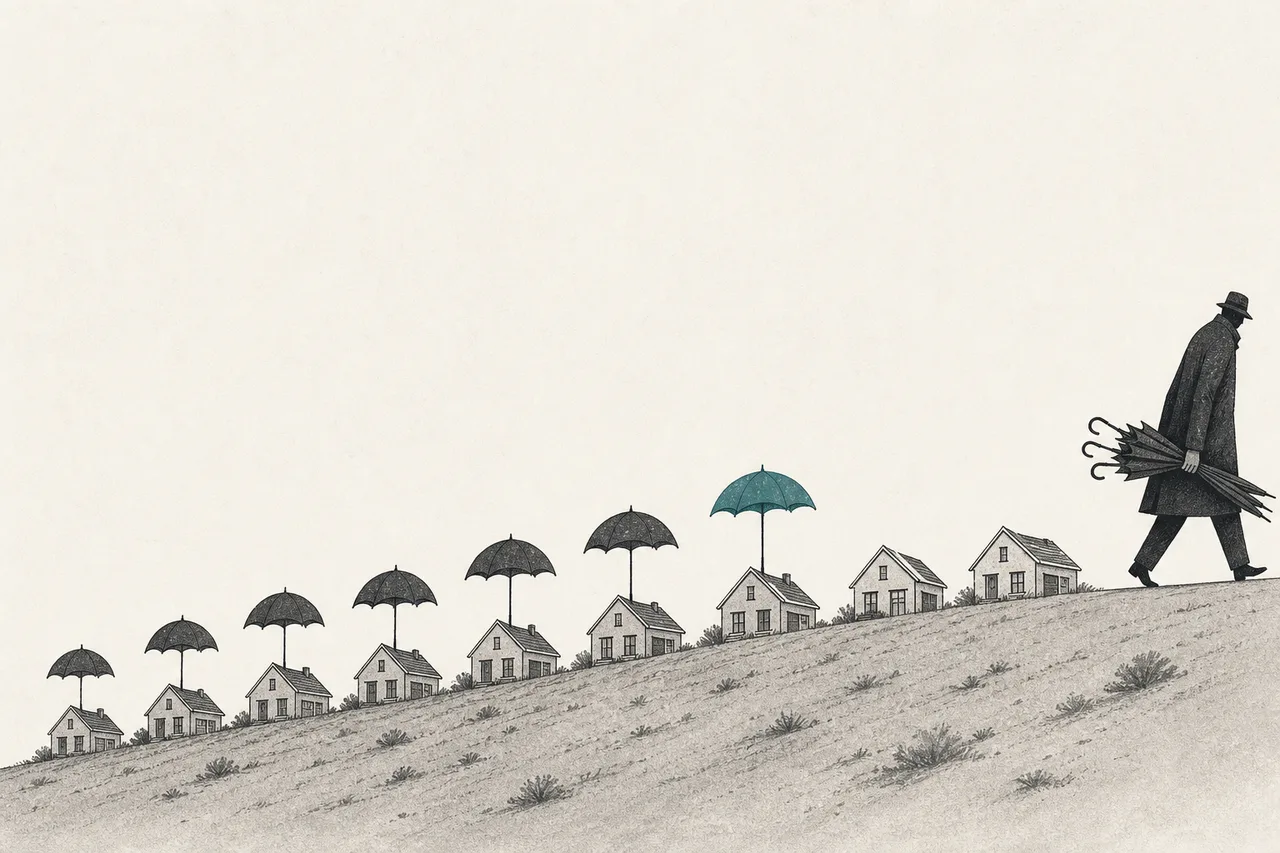
The most worrying part of "now" is the retreat of insurance from the riskiest areas. In California, State Farm stopped writing new home policies in 2023 and didn't renew over 30,000 home policies, forcing the state to approve a 17% emergency premium hike in mid-2025. In Florida, at least 10 insurers have left the market or gone insolvent since 2021 — no picture shows more clearly that when risk gets too high to "price profitably," the insurance market simply breaks down in some places.
07The road ahead
The first direction is models that "look forward," not just backward. Catastrophe models used to be built from the statistics of past events, but as the climate changes fast, the past stops being a good stand-in for the future. So firms like Verisk and Moody's RMS are racing to build models that adjust to future warming scenarios (climate-conditioned) — whoever does it more accurately gains a huge edge.
The second direction is the fusion of insurance and capital markets. As losses grow too big for the insurance industry's "wallet" to absorb, the capital markets will take on more risk through cat bonds and parametric insurance that pays out automatically off data (for example, if wind speed exceeds X, it pays immediately without assessing the damage) — helping close the protection gap in emerging markets that traditional insurance can't reach.
The third direction is the opportunity in emerging markets. The protection gap is heavily concentrated in developing countries — in Asia-Pacific in 2025, only ~12% of natural-disaster losses were insured (about $9bn out of $73bn). That's a vast market still "open," but hard to reach because the data is thin and purchasing power is low.
08Challenges & risks
A business that sounds like "the hotter it gets, the more it wins" actually carries several layers of buried risk.
The first risk is the "model is wrong" risk. Catastrophe models are good at hazards they can simulate cleanly (hurricanes, earthquakes), but with secondary perils like wildfire the accuracy is much lower, because it depends on messy factors — fuel, wind, firefighting capacity. The 2025 LA wildfires, where losses overshot expectations, were a lesson that mispricing risk can leave the carrier (the reinsurer) with heavy losses, and the modeler with damaged credibility.
The second risk is the "soft-market cycle." The wallet side's profit is cyclical; when capital floods in and pushes prices down (as we saw reinsurance pricing drop ~12% in 2026), the peak-profit window passes. So investing in insurance and reinsurance means watching the cycle's timing — not buying when the disaster news is loudest.
The third risk is "politics and regulation." When premiums get so high they hurt, governments usually step in — holding premiums below the real risk. The result is insurers pulling out (as in California and Florida), dumping the burden onto state funds and taxpayers. "Pricing to the real risk" and "what citizens can afford" are colliding harder every year.
The fourth risk is the "systemic accident" (uninsurability). The end of this line is some areas becoming "uninsurable at all" — risk so high that no price is both profitable and affordable. When that happens, property values across a whole area can crater, and the risk flows back into the broader financial system.
In short: a warming world is turning "risk" into one of the most valuable products there is — the ones who can calculate it accurately and carry it with discipline win. But the end of this story isn't just profit. It's the question of who pays when disasters get too expensive to insure — and that's why this little node matters to the whole world economy far more than its size suggests.