Megatrend · whole-trend overview
The money you pay to "survive" a hotter world
Most climate trends are about "cutting carbon" to stop the world from warming — but this lesson is about the opposite: accepting that the world will get hotter for sure, and getting ready for it. Water shortages, extreme heat, floods, wildfires, storms — all of it is already happening, whether or not carbon policy succeeds. And it's creating a massive, unavoidable wave of investment demand. This lesson is the map that strings the 7 categories of adaptation together — with "water" at the center (each category has its own deep-dive chapter).
01The big picture: adaptation, not cutting carbon
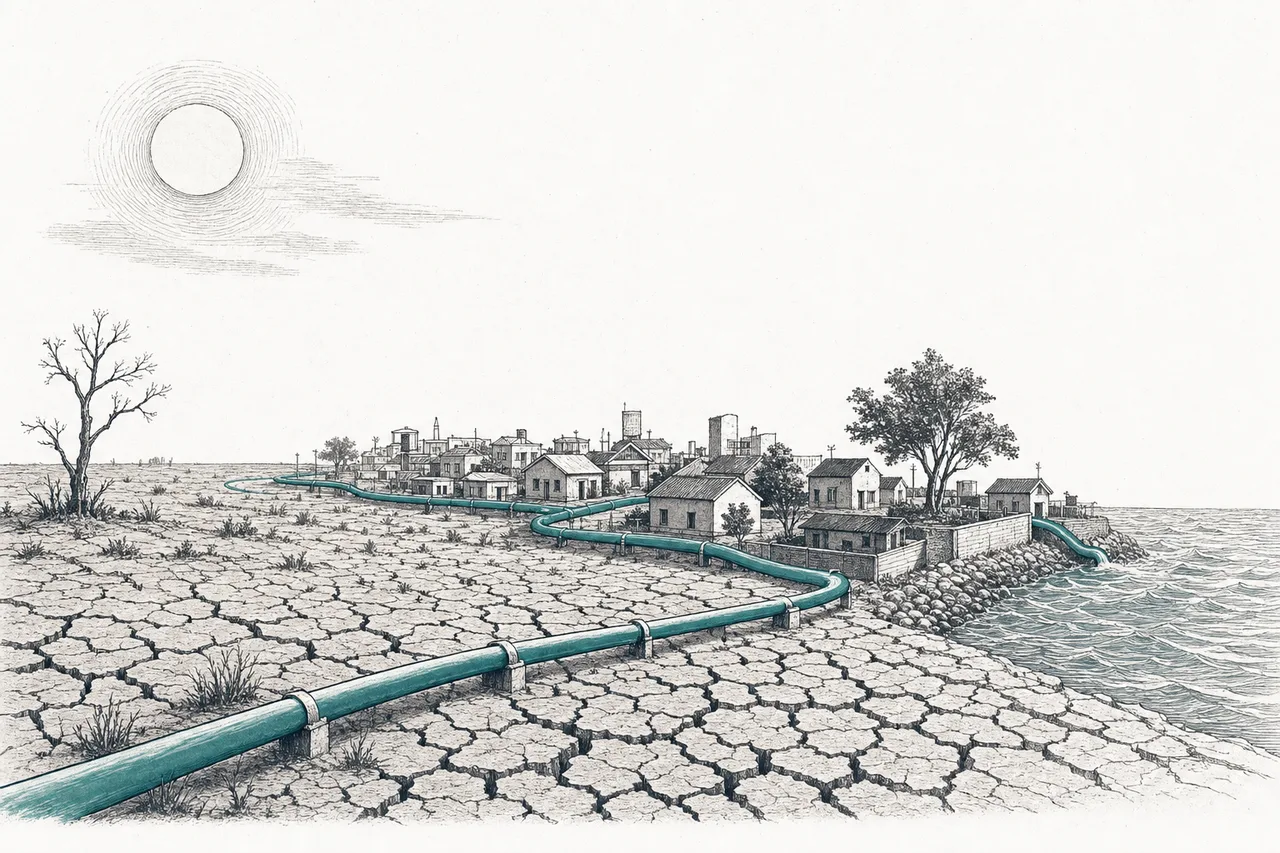
When people talk about "climate stocks," most picture solar panels, EVs, and clean energy — that's the mitigation side, trying to keep the world from heating up further. But there's another side, quieter and in some ways more certain: adaptation — accepting that no matter how well we cut carbon, the world will keep warming and the weather will keep getting more violent for decades, and actually building the armor to endure it.
This difference matters more than you'd think. Cutting carbon depends on "policy" — governments change, subsidies vanish, and demand stumbles. But adaptation is driven by a physical reality that has already arrived: 2024 and 2025 were the hottest years on record. The LA wildfires in early 2025 caused around $40 billion of insured damage in a single event. Cities around the world are running short of water, storms are intensifying — this is a bill that gets paid no matter who's in power.
UNEP estimates developing countries will need roughly $310–365 billion a year by 2035 for adaptation. But what actually flowed in during 2023 was only about $26 billion — leaving a huge "gap" that anyone selling adaptation solutions will gradually capture. That's why Singapore's sovereign wealth fund (GIC) sees the "adaptation economy" growing from about $1 trillion today to $4 trillion by 2050.
The heart of this trend boils down to one word: water — both too little (drought) and too much (floods) is the face of climate change people actually meet. So this lesson puts water at the axis and weaves the other 6 categories around it.
02The map: what are the 7 sub-categories
Climate adaptation splits into 7 categories, which group by role — some are "infrastructure" you actually build, some are a "supply chain" that makes the equipment, and some are "services" that sell knowledge or risk. Each category has its own deep-dive lesson (tap to read):
The central axis — water
- Water Utilities & Infrastructure: pipes, treatment plants, pumps, smart meters — the vein that brings clean water in and treats wastewater out. The biggest category, and the "anchor" of the whole trend
Heat-resilient & food (supply chain)
- Cooling & Heat Resilience: air conditioning, heat pumps, high-efficiency cooling — for when extreme heat becomes a matter of life and death, not just comfort
- Climate-Resilient Agriculture & Food: precision farming, drip irrigation, drought-tolerant seeds — growing food in a world with less water and wilder weather
Disaster defense (services + infrastructure)
- Climate Risk Analytics & Insurance: models that calculate disaster risk, climate data, and insurance — the "brain" that tells you where the risk is and what it costs
- Drought, Wildfire & Flood Resilience: dams, levees, early-warning systems, wildfire management — the infrastructure that takes the disaster head-on
Buildings and waste (infrastructure)
- Resilient Buildings & Retrofit: retrofitting old buildings and building new ones to handle heat and storms while saving water and energy
- Waste Management & Circular Economy: handling waste, recycling, and circulating resources — easing the load on ecosystems that are already stretched thin
03How it all connects (the stress map)
The best way to understand this trend is to see it as a "stress map" — on one side, the climate pressures bearing down (heat, drought, floods, wildfires); on the other, the business categories that "absorb" those forces. And the thing everything runs through, in the middle, is water.
Why is water the axis? Because almost every pressure eventually turns into a "water problem" — heat spikes water demand and evaporates water sources, drought is not enough water, floods are too much water, wildfires often follow drought, and both farming and cooling drink huge amounts of water. So whoever controls water infrastructure stands where every category has to lean — much like a chip fab is the heart of the semiconductor supply chain.
This trend is also deeply entangled with others. It's the "twin" of the energy transition (one side cuts the cause, the other deals with the result), it rests on materials and supply chains (pipes, pumps, steel, copper), and it extends into smart cities through sensors and smart meters that watch water systems in real time.
04Where the value and power sit
The key rule of this trend is that value and profit pool in "infrastructure you can't do without" — the categories that are essential services, with steady revenue tied to long-term contracts or regulation, have the most pricing power and ride out economic cycles best. The categories selling commodity goods on price end up fighting price wars.
Water is the clearest example of the "picks and shovels" of adaptation — whether it's hot, dry, or flooded, every scenario ends with water that has to be pumped, treated, filtered, and delivered. So the people selling pumps, valves, treatment systems, and meters (like Xylem and Veralto) collect money no matter who "wins" the climate game. And a regulated water utility like American Water earns returns the law guarantees — slow but sure, like a bond.
Notice that the most "boring" categories — water, waste, air conditioning — are home to companies worth tens of billions of dollars, because they're basic services you can't cancel. Service categories like insurance and risk analytics are the opposite: their value sits in "data and models" rather than factories — Verisk's catastrophe models are used in over 110 countries, built up over nearly 40 years, becoming a moat that's hard to copy.
The lesson for reading this trend: don't just ask "is this company about climate?" — ask "does it sell an essential service with steady revenue, or does it sell something anyone can make?"
05The forces moving the whole trend
Even though each category is different, 4 big forces move the whole trend at once:
1. Physical reality (independent of policy) — this is the force that makes this trend special. Demand doesn't come from subsidies or hype; it comes from air that's actually getting hotter and disasters that are actually getting more frequent. You can see it most clearly in surging "cooling demand" — the IEA estimates air conditioning will draw an extra ~697 TWh of electricity by 2030 (10% of the world's electricity-demand growth), and cooling demand will triple by 2050.
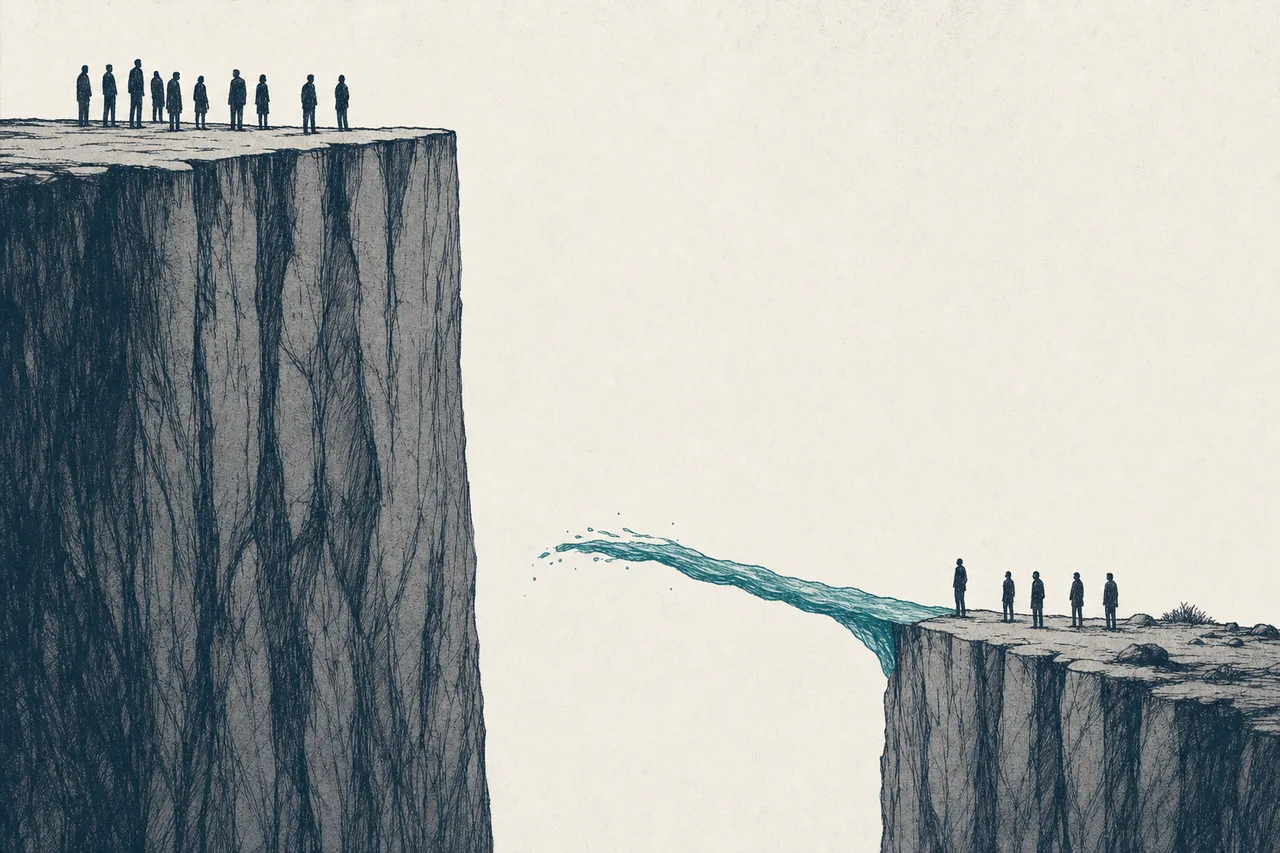
2. The adaptation-finance gap — the world is investing wildly "too little" in defense even as demand surges. This gap ($284–339 billion a year in developing countries) is pent-up demand that will keep getting unlocked by public money, sustainability bonds, and blended finance.
3. Resilience mandates — governments and regulators are starting to require climate-risk disclosure, update building codes, and upgrade infrastructure. The US, for instance, is expected to invest over $100 billion a year in municipal water by 2030 — demand tied to law, not goodwill.
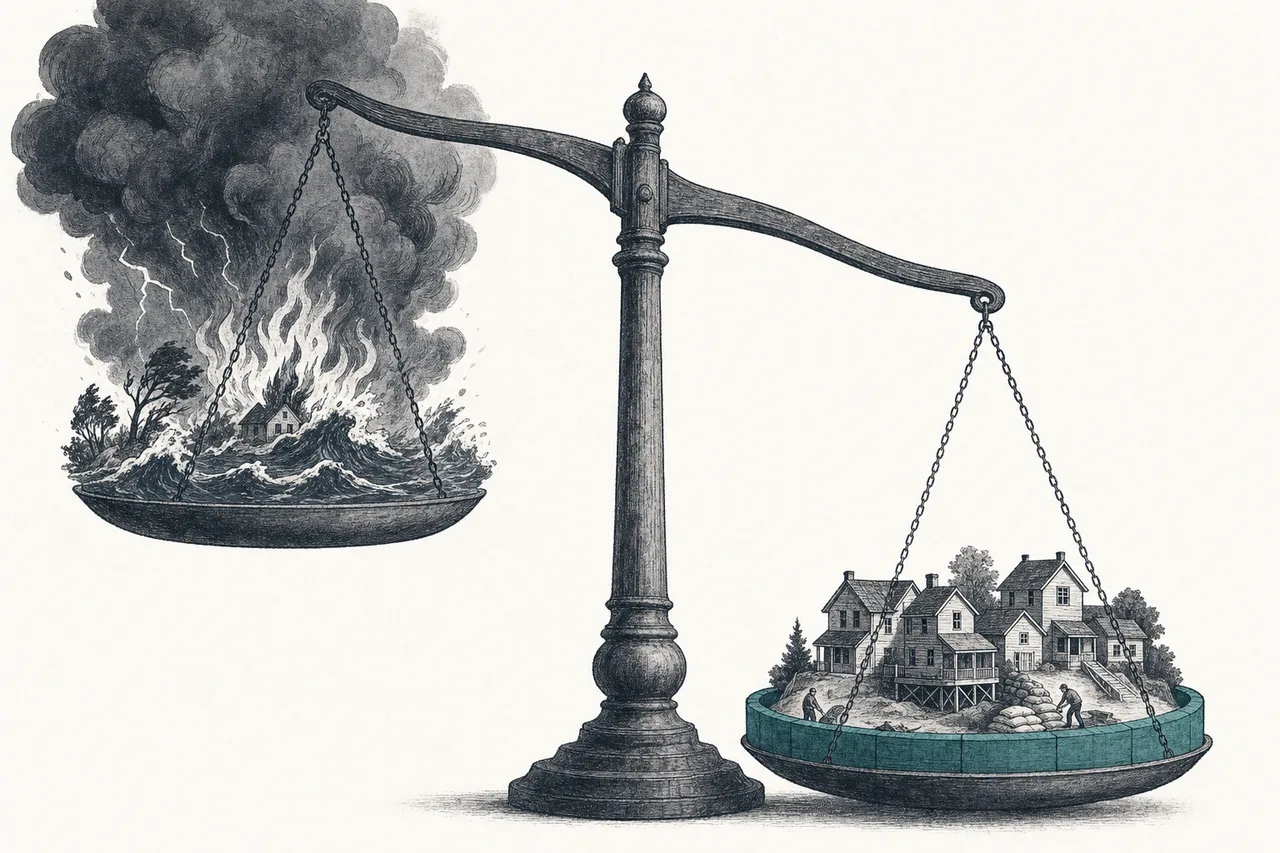
4. Insurance repricing — as losses surge, insurers raise premiums, pull out of risky areas, or refuse to cover them at all. This force pushes homeowners, cities, and businesses to "invest in defense" just to stay insurable — making it one of the most powerful indirect demand engines of all.
06Where it stands now + each category's champion
2025–2026 is when this trend shifts "from a topic in academic reports to a line in the balance sheet" — after the LA wildfires, European floods, and heatwaves across Asia, demand for resilience genuinely accelerated. Below are the "champions" of each category, showing how the power is spread across the US, Europe, China, and Japan:
07The future and the risks
Looking ahead, this trend has an "unusually certain" tailwind, because it's driven by physics, not just popularity. But there are traps to watch for too.
On the opportunity side: the investment demand for water alone is enormous — the World Bank estimates the world needs around $7 trillion for water infrastructure by 2030, but actual investment still falls about $3 trillion short. And here's the interesting part: ~91% of today's water spending comes from the public sector — meaning there's still a huge "open field" for private players to move into.
On the risk side, there are three layers to watch:
- Mostly reliant on public budgets: because water, waste, and dams are public services, a lot of demand is tied to government budgets and politics — if governments tighten their belts, investment slows even though the need is still there
- Slow and cyclical growth: unlike AI, which grows in leaps, most categories here (utilities, waste) grow "slow but sure" — good for stability, but not a flashy growth stock. And some categories (HVAC, construction) rise and fall with the economic cycle
- The politics of climate: even though physical demand is certain, "labels" like green bonds and ESG can get played by politics, making some capital swing with the trend rather than with real need
And that's why this chapter is a "map," not a "deep-dive guide" — the real value of seeing the whole trend is recognizing that heat, drought, floods, and wildfires all string together through a single pillar: water before you walk in to explore each category in detail — just tap into the deep-dive chapter of whichever category interests you.