Megatrend · Cloud & Digital Infrastructure
When software gets too complex to watch with your own eyes, who's the one seeing everything for you?
Every time a banking app freezes, a shopping site crashes mid-sale, or ChatGPT is slow to reply — behind the scenes there's a group of engineers who have to know instantly where it broke, inside a system made of thousands of parts all talking to each other. The tools that let them see a system too complex for any human brain to follow are called Observability. The tools that let them ship new code fast and safely are called DevOps — together, they're the engine room that keeps the entire software world running. And, without most people noticing, they've become a business that makes an enormous amount of money.
01What is it?
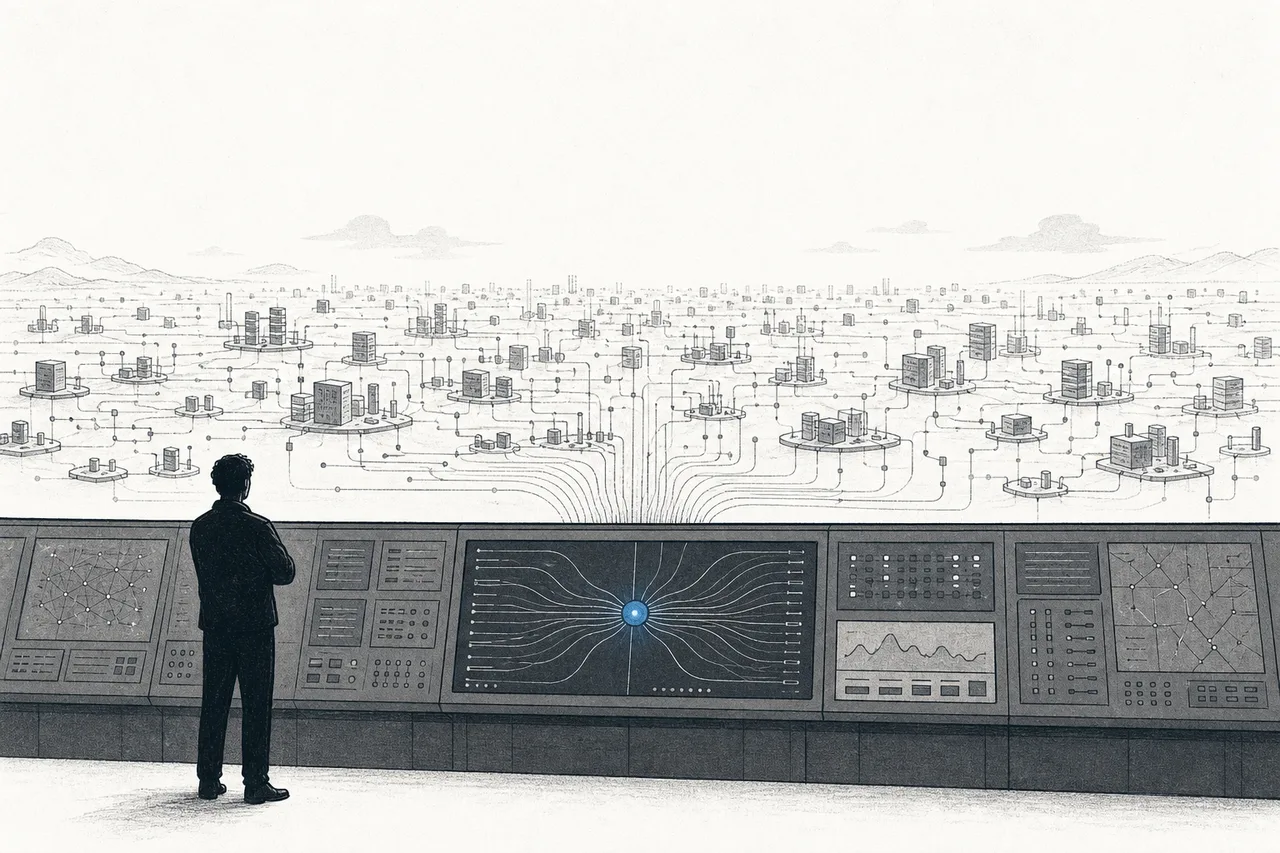
Think back to the old days. A website was one chunk of program running on one server. If it broke, an engineer just opened the "logs" on that machine and found the cause. But the apps you use today — Netflix, your banking app, a shopping site — aren't one chunk anymore. They're sliced into hundreds or thousands of "small services" (microservices), each running somewhere different on the cloud, constantly talking back and forth.
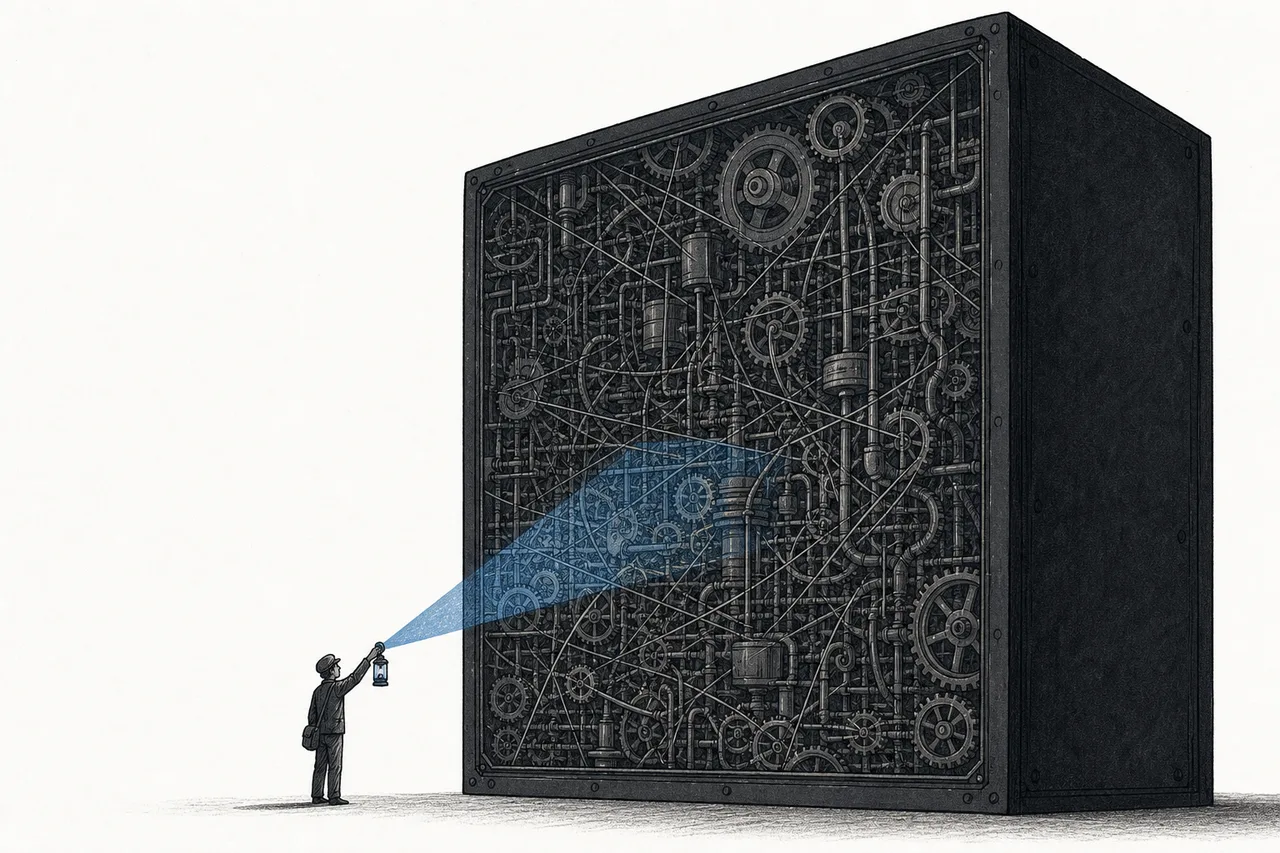
The problem: once a system gets this complex, when something slows down or breaks, no one can open each machine one by one anymore — it's like trying to figure out why a whole city is gridlocked by standing at one intersection at a time. This is the problem Observability (observing the system) was born to solve.
This node brings together two families of tools that work as a pair in a software engineer's life:
- Observability (seeing how the system is doing): platforms that suck in data from every part of a system into one place, show you "how healthy the system is right now," and alert you the instant something goes wrong — including tools called APM (app performance monitoring), log management, and tracing
- DevOps / CI-CD (shipping new code fast and safely): tools that let a team write code → test it → put it into production automatically, many times a day, without breaking things on release
Monitoring = deciding in advance which values to watch, like "alert me if CPU goes over 90%" — it can only answer questions you thought of beforehand · Observability goes a step further: it collects data detailed enough that you can ask new questions you never thought of, like "why do only customers on an iPhone in Thailand fail to pay at 3pm?" — without adding any code. That's what you need when a system is too complex to predict its problems in advance.
On the megatrend map, this node is a sub-theme of Cloud & Digital Infrastructure, sitting in the "platform layer" — not the hardware, not the cloud itself, but the software that sits on top of the cloud to watch over everything running on it.
02Why it matters — software's control room
The reason is simple: every minute a system is down = money disappearing. A shopping site down for an hour on a big sale day can mean tens of millions in lost sales. A stock-trading app freezing during a volatile market can mean a lawsuit. The more every business moves onto software, the more "the system must not go down — and if it does, it must be fixed fast" becomes a matter of life and death.
As a result, this group of tools has become a big — and fast-growing — market. The observability market alone is around $3B in 2025 and is expected to grow to roughly $6B by 2030 (about 12–16% a year, depending on the research firm). The broader DevOps/CI-CD market sits at roughly $16–20B in 2025, and many firms see it hitting $44–80B early next decade, growing around 20% a year.
But the market-size number is smaller than the value the stock market actually assigns, because the leaders here are seen as "infrastructure that's hard to rip out." Datadog, the observability leader, had full-year 2025 revenue of about $3.39B (up ~26%) — yet its company value runs into the tens of billions, because once a company "plugs" a tool into its own system, switching to someone else is very painful.
03How it works (the three pillars)
At the heart of observability is an idea called the "three pillars" — three kinds of data that every part of a system emits, which a platform assembles into one big picture. Think of the system as a patient a doctor has to diagnose; the three pillars are three kinds of tests:
- Logs — answer "what happened": messages each part writes down when something happens, like "at 14:03, this user failed to pay because their card expired" — like a very detailed diary of the system
- Metrics — answer "how healthy is the system": summary numbers measured at intervals, like requests per second, average response time, % memory used — like vital signs (pulse, blood pressure) that tell you at a glance whether things are normal
- Traces — answer "which way did this request go": when you press "pay" once, that request travels through maybe 20–30 small services; a trace follows the whole path — where it stopped and where it got slow — like GPS tracking a parcel through each checkpoint
One pillar alone isn't enough. The real power comes from combining all three: metrics alert you there's a problem → traces point to which small service has it → logs tell you the details of why it broke — all within minutes, instead of guessing all night.
The old problem: every vendor sold tools that collected data in their own "language," so switching vendors meant tearing everything out. OpenTelemetry is an open standard that defines how to collect logs/metrics/traces in one common format — like a "standard power plug" that lets data from your system plug into any platform. It reduces lock-in to a single vendor, and it's becoming the standard everyone has to support.
04Business model: pay by volume & "bill shock"
This is the part that makes this business both "very profitable" and "the most complained about" at the same time. Most of them charge by "how much data you use" (usage / data-volume pricing) — the more logs and metrics your system sends in, the more your bill balloons.
Datadog, for example, charges across dozens of stacked line items: server monitoring at about $15 per host per month, APM at about $31 per host per month, log ingestion at about $0.10 per gigabyte, plus another $1.70 per million events to make them searchable. It sounds cheap — until the system grows, data volume spikes, and the bill explodes.
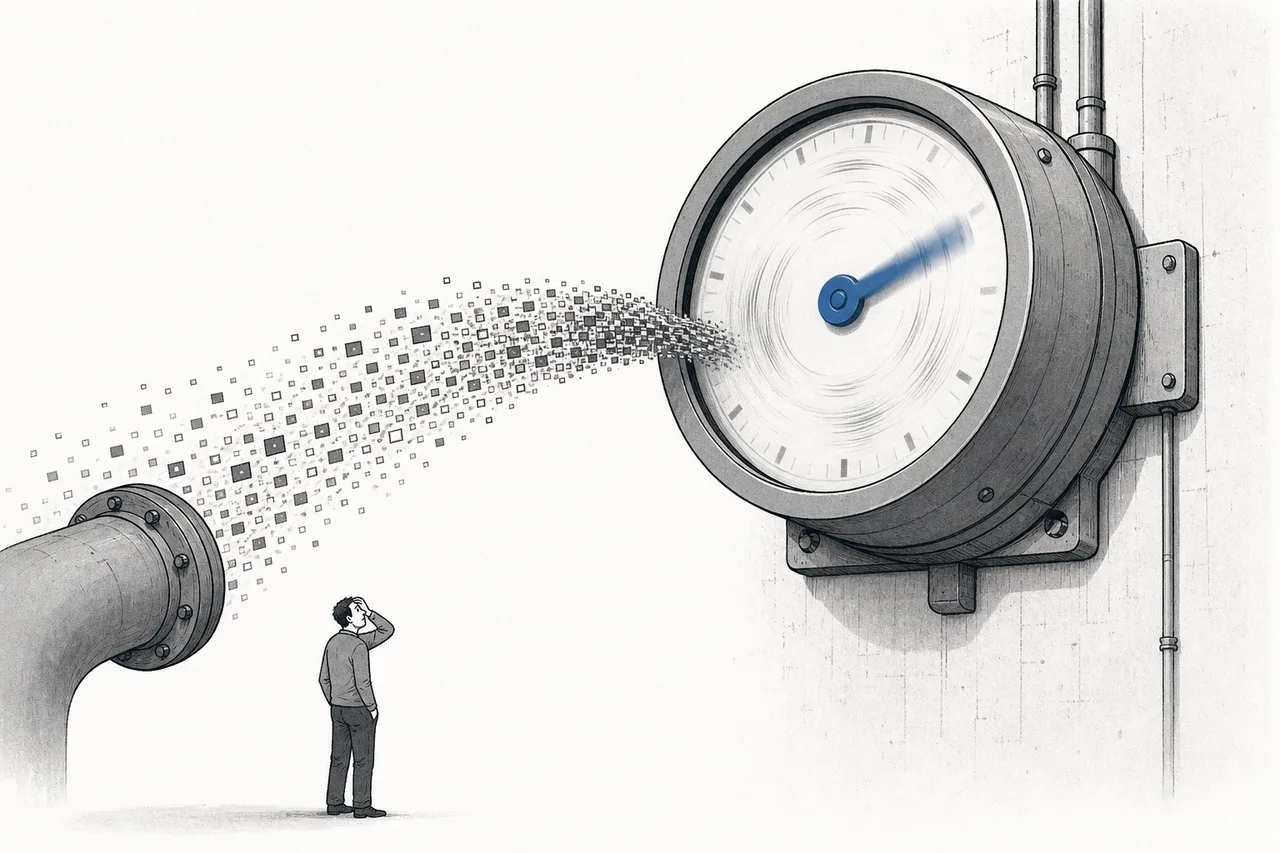
The term "bill shock" has become an industry legend — engineering teams tell of bills 3x, 5x, sometimes 10x higher than they budgeted. Not because they used it wrong, but because the costs hide in many layers (e.g. every different "tag" counts as a whole new metric, so lots of tags blow it up). A mid-size company with 50 engineers might pay around $220,000 a year; an enterprise sending 1 terabyte of data a day might pay over $1 million a year for observability alone — the equivalent of 5–8 senior engineers' salaries.
From the seller's side, this model is magic: revenue grows "naturally" every year, because every customer sends more data over time — no need to go sell anything extra (this is where net revenue retention ~120% comes from). But from the customer's side, it creates a love-hate relationship — you can't live without it, yet it stings every time you open the bill. So you get whole FinOps teams whose job is specifically "managing observability spend," and new challengers pitching "cheaper / keep your data longer for the same price."
05How it connects in the ecosystem
Observability & DevOps is the "layer that sees everything" in the cloud world, so it's tightly tied to other trends:
- Sits on top of Hyperscale Cloud: these tools watch everything running on AWS, Azure, Google Cloud — the more the world moves to the cloud, the more there is to "watch" (though the cloud providers themselves also offer their own observability to compete)
- Overlaps with Data Platforms & Analytics: because the core of observability is "storing and searching huge amounts of data fast" — Elastic started as a search tool before becoming an observability platform. The line between these two worlds keeps getting thinner
- Converges with Cybersecurity & Digital Trust: the same logs data can be used to find "where the system is slow" and to find "whether anyone broke in" — this is why Cisco paid up to buy Splunk, and why observability and security are slowly merging
- Feeds and is fed by AI Tooling & MLOps: AI models running in production are also systems that need "watching" — a new field called LLM observability has emerged to catch when AI answers wrong, answers slowly, or runs up costs
Put another way: every digital trend (AI, digital finance, smart city), once it builds software, always needs observability watching behind the scenes — so it's a "tax on complexity" for the whole industry. The more, and the more complex, the software the world builds, the more this market grows.
06Where it stands now + the players
The 2025–2026 picture has two big currents shaping this market.
The first current is consolidation into a "single platform". Engineering teams used to bolt together 5–10 tools; now everyone wants to cut down to one platform that handles logs/metrics/traces (and sometimes security too). The deal that shook the industry most was Cisco buying Splunk for $28B (closed March 2024, the largest deal in Cisco's history), adding about $4B of ARR to Cisco right away and folding the AppDynamics team under Splunk.
The second current is AI arriving both as new work to watch and as a tool inside the platform itself. Datadog revealed that "AI-native" customers (companies whose entire business is AI) made up about 8 percentage points of revenue growth in Q3 2025 — a sign the AI wave is creating an enormous amount of new things to watch.
The real leader of observability is still Datadog — a company that started as a server-monitoring tool and gradually grew into a platform that does almost everything. On the DevOps/CI-CD side there's a different crowd, led by GitLab and Atlassian, focused on writing-testing-shipping code. What's interesting is that the biggest names by stock value in this group are usually giants who do observability as a "side business" — Microsoft, Cisco, Broadcom — while the companies whose whole life is this are the smaller, more focused ones.
07The road ahead: AI is both the burden and the tool
This node's future is tied to AI like two sides of one coin — and it's the most interesting story in the market.
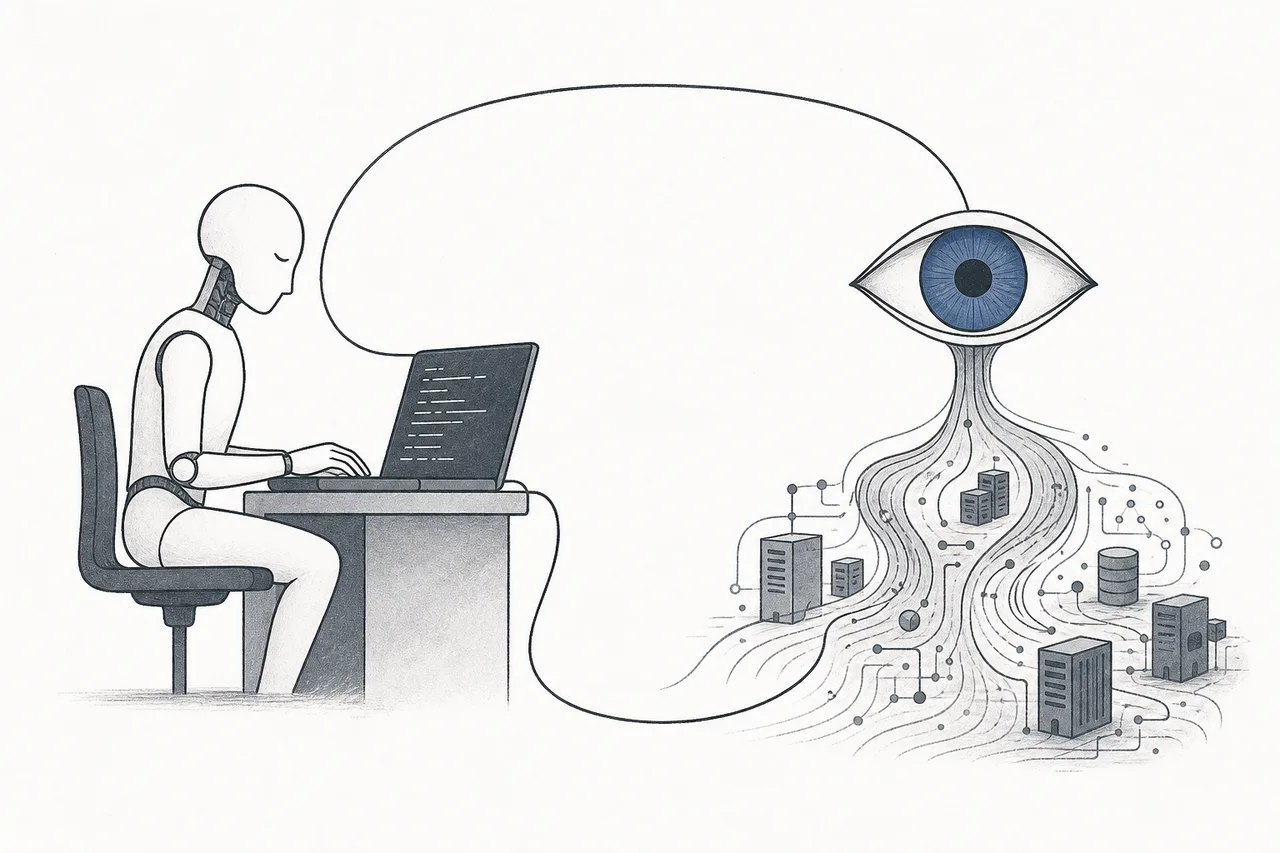
Side one — AI is new work to watch: once every company starts putting AI into its products, a flood of new things appear to keep an eye on — is the model answering correctly, is it slow, are the call costs (tokens) ballooning, is it "hallucinating"? This is a new field called LLM observability that everyone is racing to build, and one reason AI-native customers are visibly driving Datadog's growth.
Side two — AI is a tool inside the platform: observability used to only tell you "there's a problem" and leave humans to investigate. The new direction is to embed an "AI agent" that investigates the cause and fixes it itself — like Datadog's Bits AI or Dynatrace's Davis engine, which claim to pinpoint causes automatically. The endpoint is a "self-healing" system, with humans only watching the big picture.
A third direction is pressure for even more consolidation. Customers are tired of bill shock and tired of bolting together ten tools. That pressure will drive both more merger deals and the rise of open standards like OpenTelemetry that make switching easier — which is a double-edged sword for incumbent leaders who relied on "locking customers in" as their moat.
08Challenges & risks
This business's appeal (revenue that grows on its own with data volume + customers who are hard to dislodge) comes packaged with risks baked into the model itself.
The first risk is "bill shock" biting the owner back. The usage-based model makes revenue look great when the economy is good. But when companies tighten their belts, the first thing FinOps teams go after is "cut observability spend" — send fewer logs, keep data for less time, or move to a cheaper vendor. Being "ugly-expensive" is both a money-printer and a weakness that opens the door to cheap rivals like Grafana.
The second risk is open standards weakening lock-in power. As long as data is locked in each vendor's proprietary format, switching is expensive and painful. But OpenTelemetry is making observability data "portable" — once switching is easy, competition shifts back to price and quality rather than "being stuck," which pressures leaders' margins over the long run.
The third risk is the cloud and AI giants swallowing the market. AWS, Azure, Google each have their own "good enough" observability, already bundled with the cloud. Meanwhile the AI-agent wave could redefine this whole job — if one day AI can investigate and fix bugs almost entirely on its own, value might shift from "dashboards for people to look at" to "the smartest agent." Whoever adapts slowly risks being overtaken.
In short: every time your app "hasn't gone down" or "recovers fast after going down," there's a quiet industry behind the scenes seeing everything for the engineering team. It's not a flashy trend like AI or robots, but it's a "tax every digital company has to pay" — and as long as the world keeps building ever-more-complex software, the people selling the glasses to see it will have work for a long time to come.