Megatrend · whole-trend overview
The physical structure the entire digital world stands on
Every time you open an app, stream a movie, or ask AI a question, behind it sits an army of servers, buildings the size of a city, undersea fiber, and enormous amounts of electricity. This is the "plumbing and power" of the digital age — and right now the whole world is pouring money into building it, at a scale where global data-center investment is set to top $1 trillion a year. This lesson is the map that strings the 9 categories together — from the power and land at the base, up to the software we use — showing how they stack into "layers," where the money piles up, and why the real bottleneck has become "electricity" (each category has its own deep-dive chapter).
01The big picture: the backbone of the digital economy
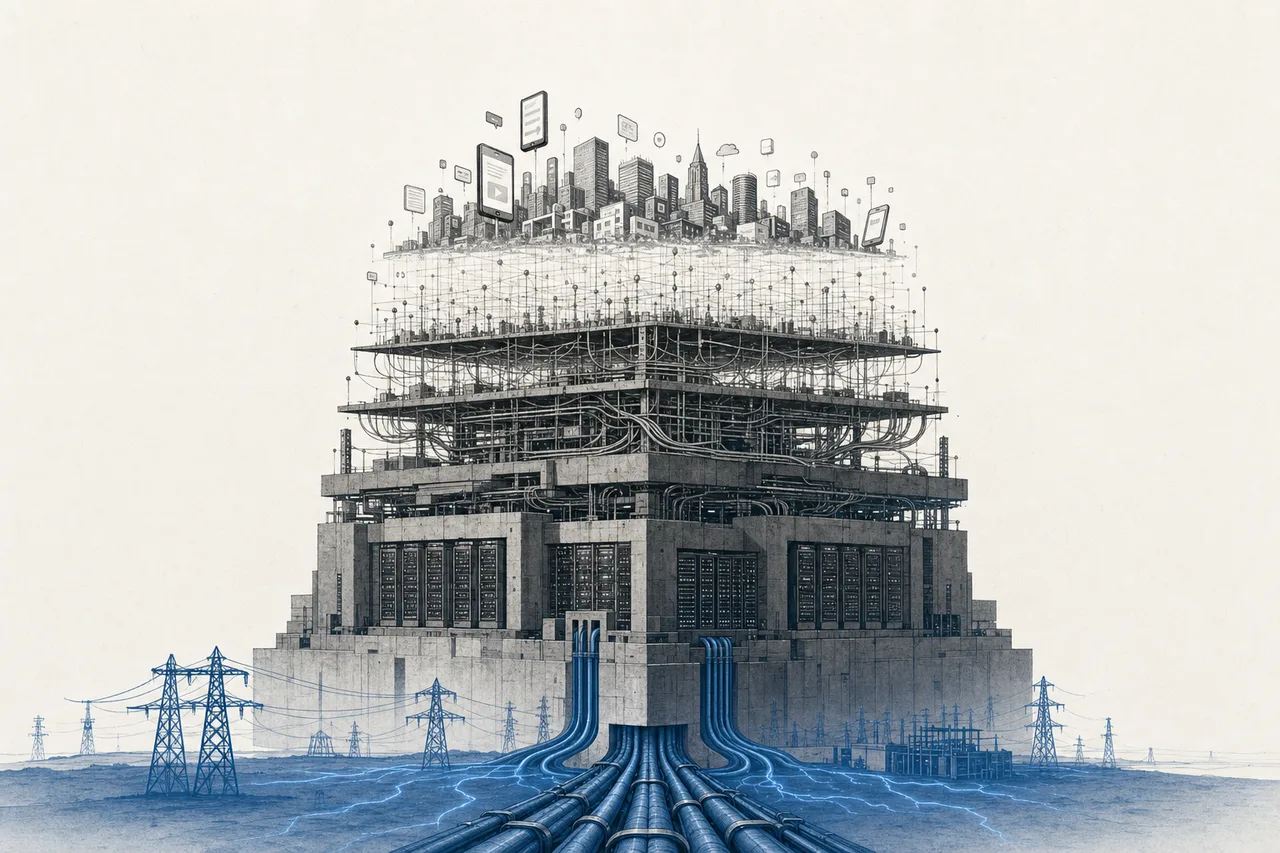
When we talk about "the cloud," we tend to picture something floating in the sky, untouchable. But the truth is the opposite — the cloud is the heaviest, most physical thing in the digital economy. It's concrete buildings the size of several football fields, packed with hundreds of thousands of servers, wired with cables as thick as your arm, hooked into the power grid and fiber that crosses oceans. This is the "plumbing and power" that everything in the digital world — apps, websites, banks, AI — has to flow through.
The scale of this construction is climbing like never before. In 2025, data-center investment (capex) worldwide rose 57% in a single year, and in 2026 it's expected to top $1 trillion a year for the first time. A handful of cloud giants (hyperscalers) alone will spend a combined $600 billion this year — up 36% from the year before.
This sum is big enough to move the whole global economy — it pushes up chip prices, pulls electricity off the grid, and has become a growth engine for the stock market. But to understand it, you first have to see that it isn't one block. It's "layers" stacked up, from the electricity at the base to the software we click to use.
02The map: 9 categories across 4 layers
The best way to understand digital infrastructure is to see it as a "stack" from bottom to top — the lower you go, the more physically real it gets (power, land, buildings, fiber); the higher you go, the more it's the software we use. The 9 sub-categories group into these 4 layers — each one has its own deep-dive lesson (tap to read):
Bottom layer — physical infrastructure (power · land · buildings · cabling)
- Telecom Towers, Fiber & Colocation: signal towers, fiber (including undersea cables), and data-center buildings for rent (colocation) — the land and concrete everything stands on
- Edge & Content Delivery: small servers spread out close to users (CDN/edge) — making websites and video load fast without running back to the central data center every time
- Enterprise Data Storage Systems: large-scale data storage for organizations — the home of all the "data" the upper layers call on
Platform layer — cloud and tools
- Hyperscale Cloud (IaaS / PaaS): companies that rent out computers over the internet (AWS, Azure, Google Cloud) — the heart of the whole trend, where everything comes to rent
- Data Platforms & Analytics: platforms that store and analyze large amounts of data (like cloud data warehouses) — an organization's "data brain"
- Observability & DevOps: tools that watch over and keep systems running so they don't crash — the "control room" of every app on the cloud
- API & Integration (iPaaS): systems that get many pieces of software to talk to each other — the "pipes" that connect apps automatically
Top layer — the software we use (SaaS)
- Horizontal SaaS: software every organization uses the same way (email, chat, documents, CRM) — the biggest, most familiar market
- Vertical SaaS: industry-specific software (hospital systems, restaurant systems, etc.) — smaller, but deeply embedded and hard to switch away from
03How it all connects (the infra stack)
The heart of this map is the word "stack" — each layer sits on the one below it and makes the one above possible. The SaaS we use (top layer) can't work without the cloud (middle layer); the cloud can't run without data-center buildings and fiber (bottom layer); and all of it goes dark the instant there's no electricity at the base. Look at this stacking and flow:
The most interesting part is that the "bottleneck" has moved. It used to be money or chips. But now it's electricity — a modern data center eats as much power as a whole small town, so building more is no longer limited by money but by "where do we get the power, and when can we hook into the grid?" This is why the trend is bound inseparably to energy and electricity demand.
04Where the value and power sit
The key rule of this trend is that value and power flow to whatever is scarce — any stage that's in short supply and hard to replicate has pricing power, while any stage anyone can do is forced into a price war. In this trend, two things are clearly scarce: (1) land + electricity at the base, and (2) cloud platforms that customers find hard to leave (lock-in).
This explains why data-center land has become precious — at the end of 2025, the vacancy rate for data centers in North America fell to a record low of 1.4%, and rents jumped ~6.6% in a single year. There's barely enough to sell. Whoever holds land with power in a good location is holding gold.
As for the top layer (SaaS), the value comes from "lock-in" — once a whole company runs on one CRM or one hospital system until every employee is used to it and all the data lives inside it, moving out is expensive and painful. That makes revenue steady and margins high — especially Vertical SaaS, which is embedded deep in specialized workflows.
The lesson for reading this trend: don't just ask "is this company in the cloud?" — ask "does it hold something scarce (power / land / a platform), or is it in a price-war zone?"
05The forces that hit the whole trend
Even though each category differs, three big forces hit the whole trend at once:
1. The AI investment supercycle — this is the biggest force. The AI wave forces every category in the stack to expand at once, from buildings and power to networks. Of the hyperscalers' roughly $600 billion in 2026 investment, ~75% (about $450 billion) is tied directly to AI — a huge opportunity and a concentrated risk at the same time (if AI slows, the whole stack shakes).
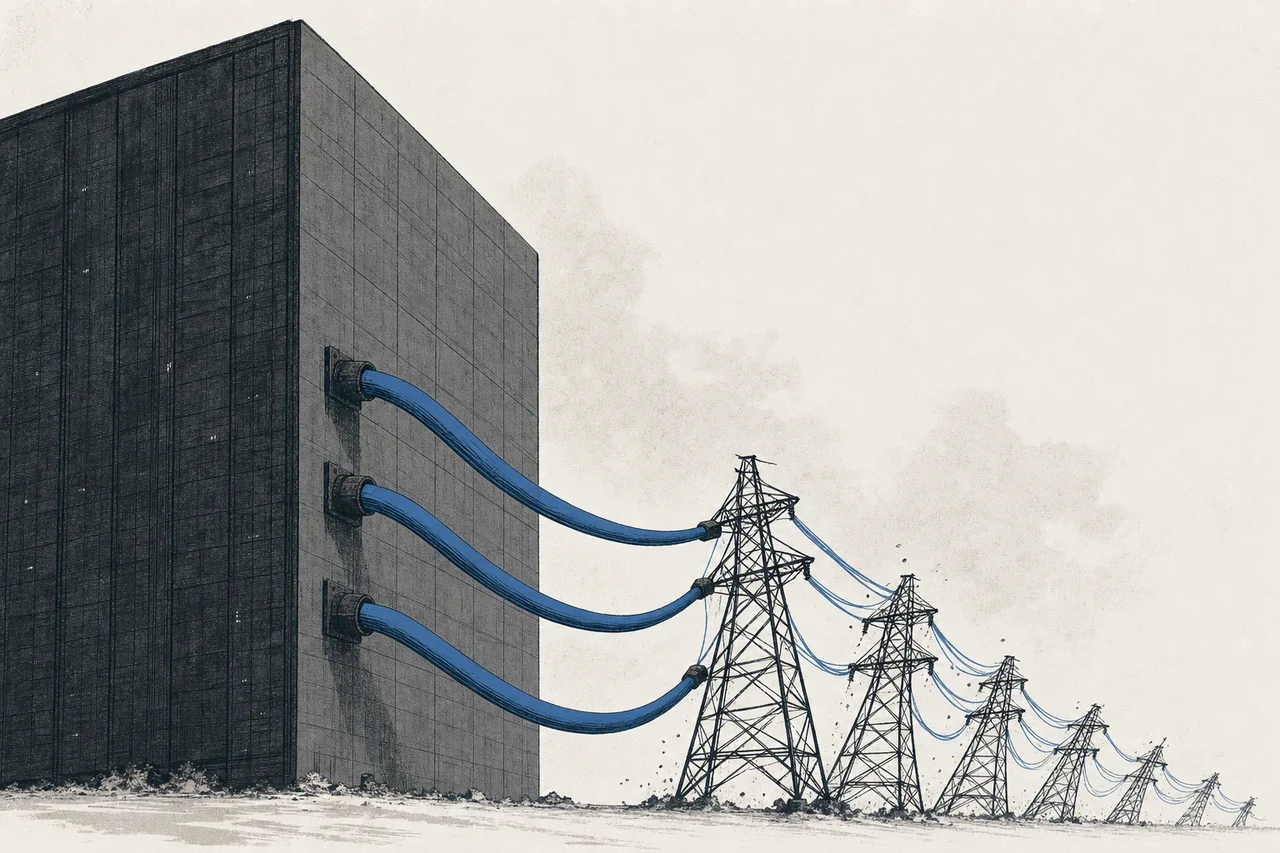
2. The electricity bottleneck — the fastest-rising force. Data centers worldwide used about 415 TWh in 2024 (roughly 1.5% of all the world's electricity) and are expected to nearly double to about 945 TWh by 2030. In the US, data centers will eat 6.7–12% of the country's entire electricity. And worse — nearly 2 terawatts of clean generation is stuck in the queue waiting to connect to the grid. Electricity has become the factor that sets how much more cloud can be built.
3. Data sovereignty and border-by-border distribution (data sovereignty) — every country is starting to pass rules that citizens' data must be kept inside the country and not flow out. That forces the cloud giants to build separate data centers in each region, turning the cloud from "one block worldwide" into "many islands, each under its own laws" — adding cost, but also opening the door for local players and new infrastructure investment in every region.
06Where we are now + the champion of each category
2025–2026 is the era when money flows into every layer of the stack at once — the cloud giants are growing double digits, the global SaaS market is around $400 billion (heading for ~$820 billion by 2030), data-center buildings are nearly full everywhere, and the network/power-system makers are growing fast. Below are the "champions" of each category, reflecting how the power is spread across many layers and many countries:
07The future and the risks
Looking ahead, this trend has both tailwinds and risks you have to watch as a pair.
On the opportunity side: demand still looks strong and spread across every layer. Global data-center investment is expected to top $1 trillion a year and keep climbing, the SaaS market is heading for ~$820 billion by 2030, the data-center network market is growing more than 17% a year on average, and the new-cloud (neocloud) market made over $25 billion in revenue in 2025 (+223%) — whoever holds something "scarce" (land, power, a platform) has strong bargaining power.
On the risk side, there are three layers to watch:
- Overbuild and the cycle: when everyone rushes to build at once with enormous borrowed money, if AI demand slows, the buildings and gear already built could flood the market and become a burden overnight — infrastructure has a nature of "slow to build, but demand flips fast"
- The electricity bottleneck: if power can't be found in time or can't connect to the grid, growth stalls right away — and fighting households over electricity could push power bills up enough to spark political backlash
- Reliance on a few giants + data rules: the three Big hold ~68% of the cloud, leaving the whole economy dependent on a few players, while ever-tightening data-sovereignty rules force duplicate investment in every region
And that's why this chapter is a "map," not a "deep-dive guide" — because the real value of seeing the whole trend is seeing that every app on our screens ends up, in the end, at a power outlet and a patch of land before you walk in to explore each layer in detail — just tap into the deep-dive chapter of whichever category interests you.