Megatrend · Critical Materials
The metal that, once mined, never disappears — and this year it broke $4,000
Copper gets buried in wiring for good, oil gets burned away, but almost every gram of gold humans have ever mined is still with us today. That makes gold not an industrial material but money no one can print more of. In 2025, central banks around the world scrambled to buy gold to flee the dollar, driving the price to 53 record highs in a single year and past $4,000 an ounce for the first time. This lesson explains why gold is special, who actually moves the price, how gold is dug out of rock, and who the real mine owners are.
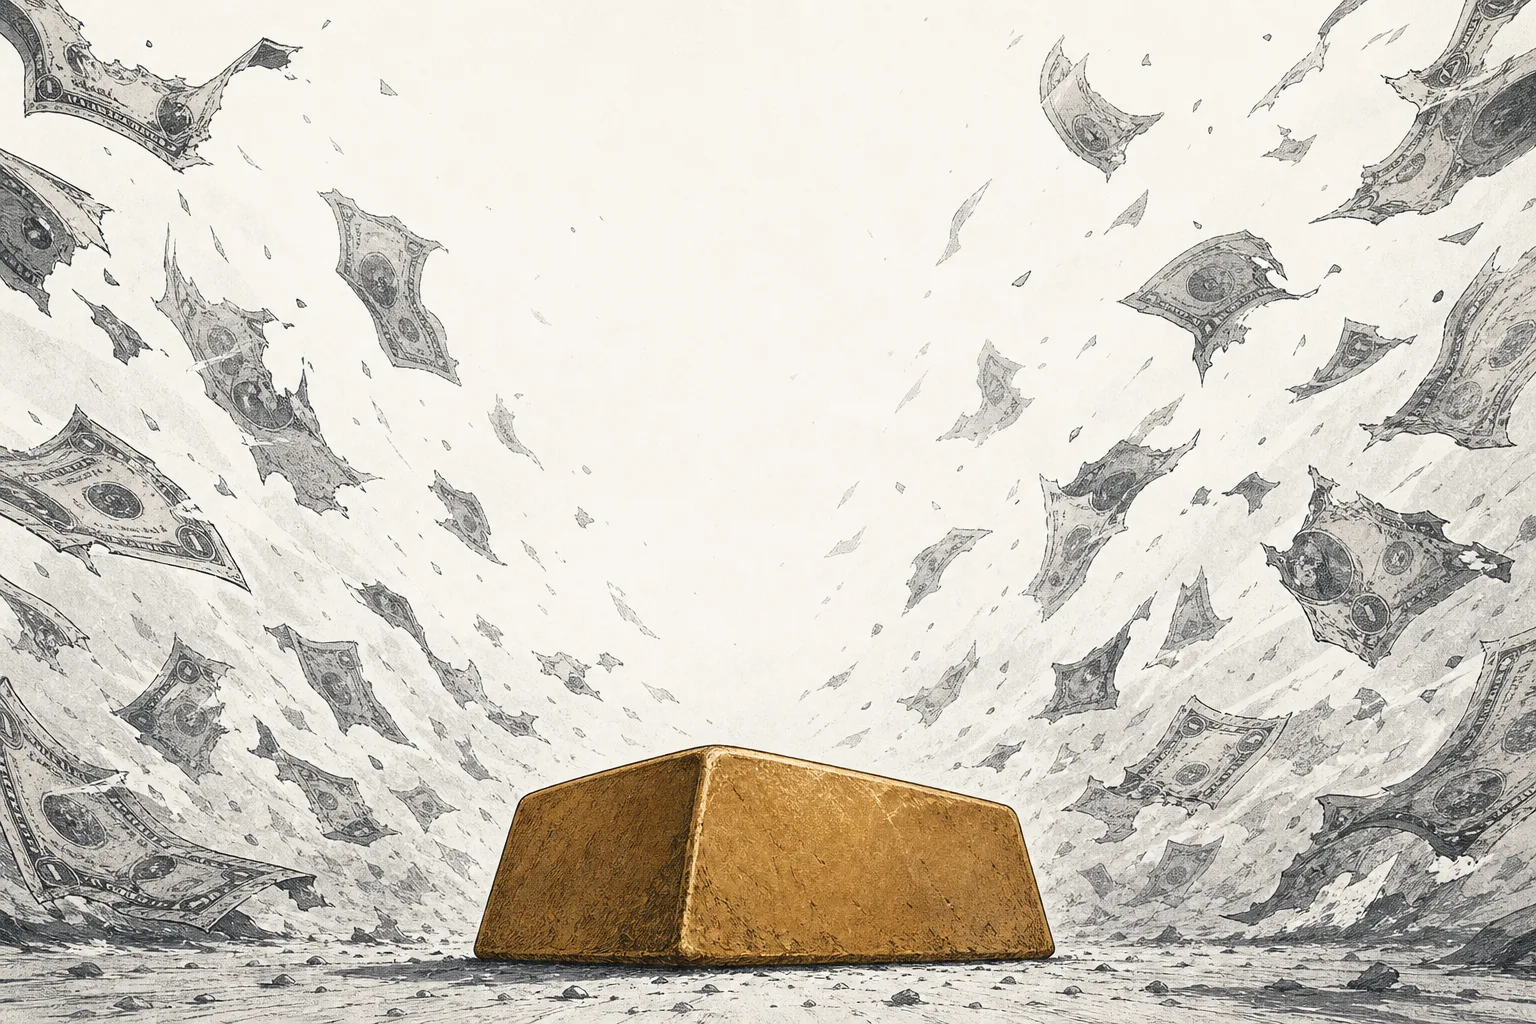
01What gold is (the thing that's never used up)
Here's a thought: the gold ring on your finger might contain atoms of gold that were once a Roman-empire coin, then a pharaoh's jewelry, remelted dozens of times across two thousand years — and it's genuinely possible, because gold is a metal that barely reacts with anything. It doesn't rust, wear, or rot. The result: almost every gram of gold humans have ever mined is still here today.
This is what sets gold apart from every sibling in the materials family. Copper gets buried in wiring, lithium locked in batteries, oil burned into smoke — those are all “consumed”. But gold isn't used up; it just moves — from mine to jewelry, to a bar in a vault, and one day it's melted back down again. All the gold ever mined in history adds up to roughly 216,000 tons — melt it all together and it's a cube only about 22 meters on a side, small enough to sit comfortably on a soccer field.
The total amount of gold ever mined that's still in the world — jewelry, investment bars, central-bank reserves, and inside electronics — adding up to about 216,000 tons. Because gold doesn't decay, this stock keeps growing and never shrinks, unlike other commodities that get used up once produced.
On the megatrend map, gold is a sub-branch of Precious Metals under the Critical Materials & Supply Chain megatrend — but it's the “black sheep” of the category. Siblings like copper or rare earths are valuable because the world is running short of them; gold is valuable because the world is afraid. Its price barely depends on factories or cars — it depends on interest rates, the dollar, and distrust in the financial system.
02Why it's not like other commodities
The key is the phrase “can't be printed.” Central banks can conjure up more dollars or yen in an instant, but no one can conjure up more gold. New gold comes from one place only — digging it out of the ground — and all the mines in the world combined produce just about 3,300 tons a year, only ~1.5% of the existing stock. Put another way, even if every mine on Earth dug flat out, the world's gold supply would grow by less than 2% a year.
This ratio has a name — stock-to-flow — and it's very high for gold (huge stock, tiny new inflow). This is the heart of why the gold price isn't set by mines: the gold mined in any one year is just a sliver of the gold already circulating. So the price is set by “whether the people holding it want to keep holding or want to sell” more than by “how much the mines dig up” — unlike copper, whose price tracks mine supply directly.
An asset people rush into when markets get volatile or they distrust the financial system. Gold is the king of this group because there's no risk that anyone “defaults” on it (unlike bonds, where a government might) and no one can print more to dilute it. The downside is that gold pays no interest or dividend — hold it and you get only the price. So it's most attractive when interest rates are low.
2025 drove this home like never before. Global gold demand broke 5,000 tons for the first time in history, worth over $555 billion, and nearly all of the growth in buying came not from factories but from people wanting a “shelter” — investors and central banks.
03Where gold goes + who moves the price
The gold mined and circulated each year flows in four main directions, and knowing who buys gold for what is the key to understanding why the price moves. In 2025, gold demand broke down into jewelry ~1,638 tons, bars and coins ~1,374 tons, central banks ~863 tons, ETFs ~801 tons, and industry/technology ~323 tons.
At a glance, jewelry looks like the biggest — but that's the trap in understanding this. Because jewelry buyers are “price-takers” — the pricier it gets, the less they buy (in 2025 jewelry volume fell 18% as prices grew out of reach). So jewelry doesn't drive the price; it “follows” the price.
What actually moves the price are the two groups that buy out of “fear,” not “wanting to look good” — namely investors (through bars, coins, and ETFs, together over 2,000 tons in 2025, with investment value roughly doubling to about $240 billion) and central banks. These two buy more as the price rises (the opposite of jewelry), and this is the engine of the current bull market.
Notice the big shift in gear: before 2022, central banks worldwide bought an average of only ~473 tons/year, but since 2022 they've bought over 1,000 tons three years running. Even though 2025 “slowed” to 863 tons (as high prices made buying harder), it's still nearly double the earlier era. The question is: why did central banks suddenly start hoovering up gold? — the answer is in the next chapter.
04Why the price broke $4,000
2025 was a historic year for gold. It set a new all-time high 53 times in a single year, the full-year average price surged to $3,431/oz (+44% from the prior year), and in October 2025 gold broke $4,000/oz for the first time in history before holding above that level into 2026.
What pushed gold this hard? Three main forces arrived together.
The first and biggest is the flight from the dollar (de-dollarisation). The turning point was 2022, when Western nations froze Russia's dollar reserves after the Ukraine war. That sent a shock signal worldwide: “the dollars in your reserves could be frozen if you cross Washington.” Many central banks — especially China, India, Turkey, Poland — began cutting their dollar share and turning to gold, because gold is the one asset no one can freeze and that isn't anyone's debt.
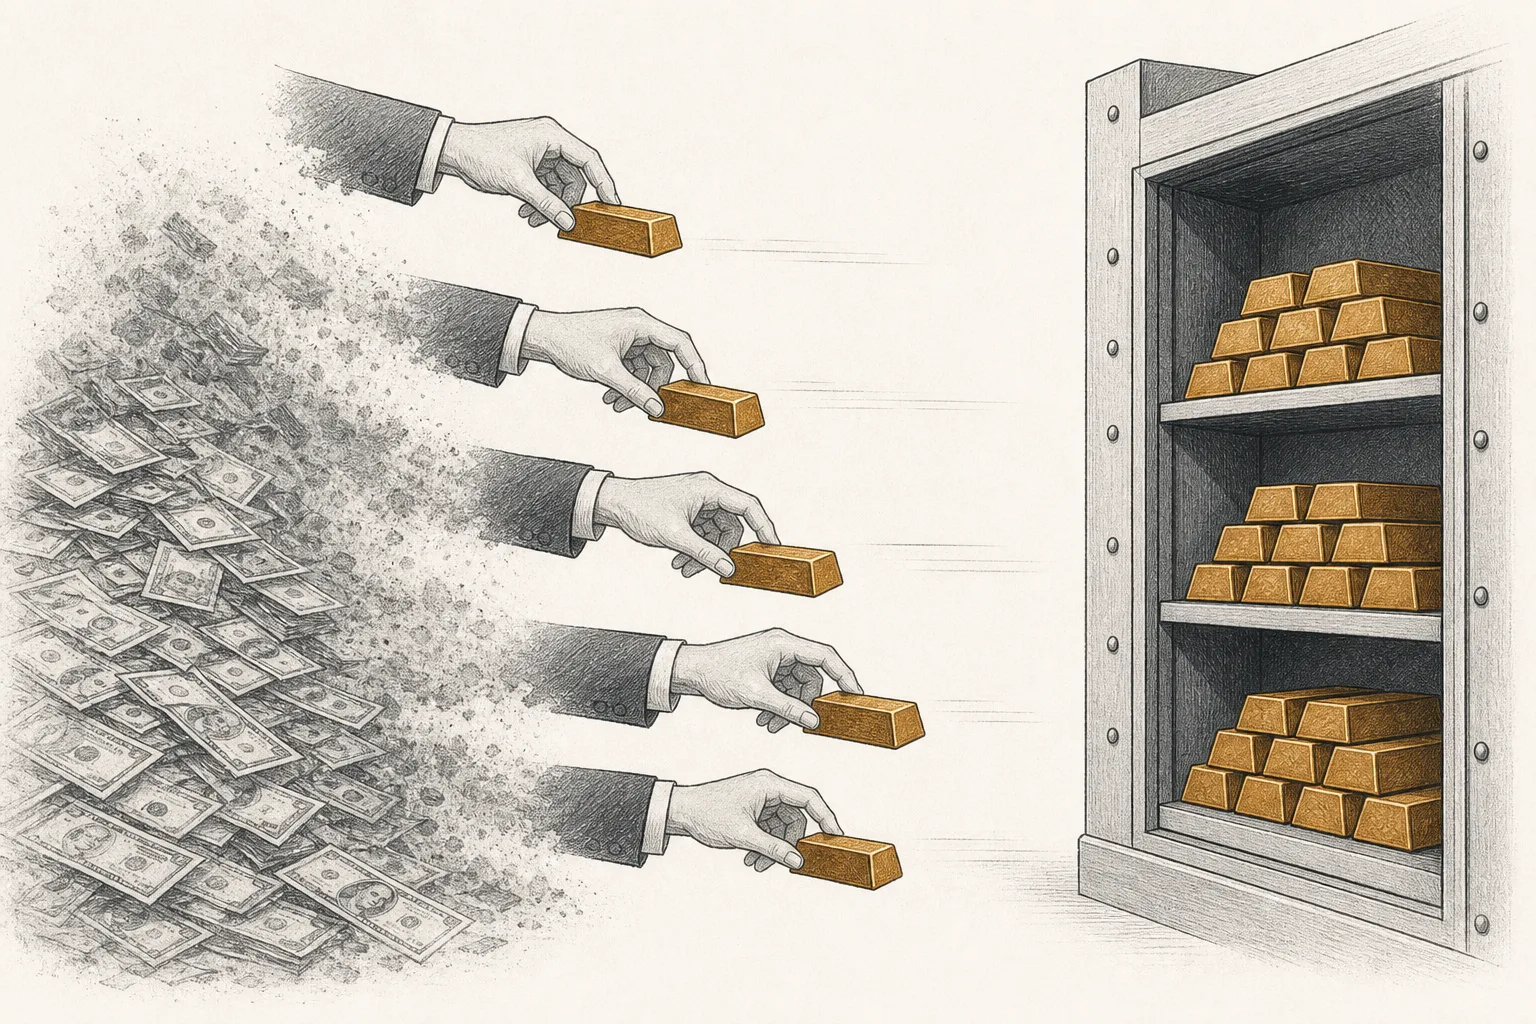
The second force is falling interest rates. Gold pays no interest, so when bonds yield a lot, people don't want to hold gold. But when the US Federal Reserve (the Fed) started cutting rates in October and December 2025, with markets expecting more cuts in 2026, the “opportunity cost” of holding gold dropped — making gold instantly more attractive.
The third force is fear of geopolitics and debt. Wars, trade tensions, and the relentlessly rising government debt of major economies push investors to look for “insurance” outside the normal financial system — the more uncertain the world looks, the more gold shines. Analysts at several big banks have even set 2026 gold price targets in the $4,800-6,500/oz range, though those are only projections still to be proven.
05How gold is mined (grade · cost · margin)
Now for the “real” side. Every gram of new gold starts with digging rock, and the most shocking number in this industry is “ore grade” — the share of gold in the rock. A modern gold mine digs rock containing on average just about 1 gram of gold per ton (open-pit mines around 1-4 g/ton, higher-grade underground mines 4-10 g/ton). Put plainly, gold is diluted in rock at a “one-in-a-million” level.
What does a grade of 1 g/ton mean? It means that for just 1 ounce of gold (about 31 grams, the weight of one gold coin), a mine has to dig and crush roughly 31 tons of rock — as heavy as an entire truck. And this grade keeps “thinning” every decade. In the 1950s, a ton of rock yielded about 10 grams of gold; today it's less than 1 gram at many mines, because the high-grade deposits were dug out first.
This brings us to the most important number in the gold-mining business: AISC (All-In Sustaining Cost) — the “all-in” cost of mining one ounce of gold, covering everything from labor, energy, and chemicals to mine maintenance. In 2025 the industry median was around $1,600/oz (low-cost mines in West Africa came in under $1,000, while deep South African mines hit $1,650).
So which countries does gold come from? Unlike PGMs, concentrated in South Africa, gold is fascinatingly spread across the world. The biggest producer is China (~380 tons/year), followed by Russia (~330 tons) and Australia (~284 tons), with no country holding more than ~11% of the world. This spread means gold has no “single-country chokepoint” like rare earths or PGMs.
06What it connects to
Gold sits under Precious Metals alongside two siblings with wildly different temperaments — PGMs (platinum-palladium), which are “industrial,” embedded in car exhausts with prices tied to auto output, and silver, a “hybrid” — half safe-haven like gold, half industrial (solar panels). Gold is the only one of the three that barely relies on industry at all: its technology demand is only ~323 tons, about 6% of the total.
But gold's most interesting connection isn't in the materials category at all — it's with the financial world. Gold is a direct “rival / substitute” of Digital Finance & Tokenization, because bitcoin is sold as “digital gold” — an off-system asset that also can't be printed. Some younger people choose bitcoin over gold, so the two assets compete for the same “off-system safe-haven” money.
On the other side, gold gets a direct boost from Defense & Geopolitical Fragmentation — the more the world splits into blocs, the more wars and sanctions there are, the more central banks fear relying on the dollar and turn to gold. This is why the node's definition says gold is driven by “interest rates and fear,” not by “scarcity from the energy transition” like copper or lithium.
07Who owns this arena
If you want to invest in “gold” through stocks, you first have to understand that gold-mining companies don't move one-for-one with the gold price — they move with “leverage,” because costs (AISC) are relatively fixed. So when gold rises 20%, a mine's profit might surge 50-100% (and vice versa when the price falls). The players in this arena split into roughly 4 groups.
First group — the global giants that produce millions of ounces a year and spread mines across continents to reduce single-country risk, led by Newmont (the world market leader), Barrick, and Agnico Eagle. Second group — emerging-market champions like AngloGold Ashanti (South African roots) and China's rising force. Third group — royalty/streaming companies that don't mine themselves but buy “rights to a share of the gold” from others' mines (the highest-margin model in the industry), led by Franco-Nevada.
A model where a company like Franco-Nevada pays a mine a lump sum today in exchange for the right to buy gold from that mine very cheaply over its whole life. So they get “leverage to the gold price” with fixed costs, without facing the risks of labor, power outages, or runaway mining costs — which is why this group usually has the highest margins in the mining industry.
08The future and the risks
Gold's biggest question right now is “Is this bull market structural, or just a bubble?” The bulls argue central-bank buying is a long-term structural story — the flight from the dollar isn't a passing fad but a reshuffling of the whole world's reserves that will take years, plus falling rates and still-surging government debt, which is why several big banks target gold reaching $5,000-6,000 in 2026.
The supply side supports the price too. There are warnings about “peak gold” — high-grade deposits are nearly dug out, average grades thin every year, and opening a new mine takes a decade, so new gold supply grows very slowly. Even with prices surging, mines can't ramp output fast enough to meet demand in the short term.
But the risks are just as clear. First — gold is pure “belief.” It pays no interest or dividend; its entire value comes from other people accepting that it has value. If real interest rates return high, or fear eases, gold — after a year of back-to-back records — risks a sharp correction. Gold sat flat for years after its 2011 peak, remember.
Second — if central banks stop buying or start selling, this cycle's biggest support vanishes. The fact that buying “slowed” to 863 tons in 2025 is a signal that prices too high make even central banks hesitate. Third — mine-specific risk: for those who invest through stocks (not by holding gold directly), there's still the risk of surging costs, labor, politics in the host country, and management missteps — a mining stock can lag the gold price if its costs are poorly run.
In short: gold is the strangest metal in the materials world — the thing that, once mined, never disappears, valuable because it “can't be printed,” with a price that depends not on factories or mines but on the fear of the whole world. In an era when trust in paper money is shaking, gold is a star once again — and to understand why central banks are scrambling to buy it is to understand what the financial world is afraid of.