Megatrend · whole-trend overview
When the world stops trusting each other and starts rearming
After the Cold War, the West slowly cut defense budgets as if peace were permanent — then Ukraine, the Middle East, and great-power rivalry flipped all of it. In 2025, global military spending hit a record ~$2.89 trillion, and NATO just pledged to push budgets all the way to 5% of GDP. This lesson is the map that strings the 10 categories of the defense industry together — who builds what, how it connects, and where the value piles up in this new wave of rearmament (each category has its own deep-dive chapter).
01The big picture: the world's new wave of rearmament
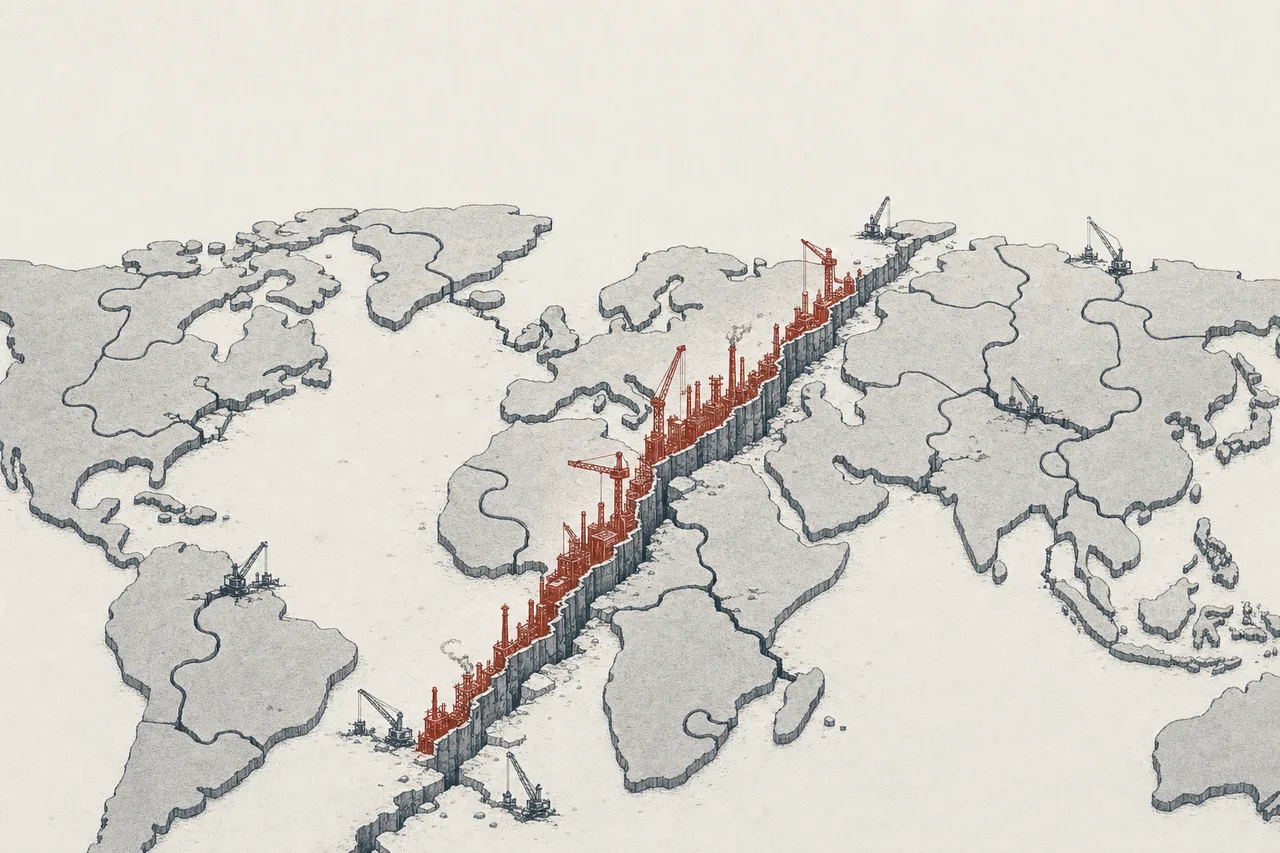
For nearly 30 years after the Cold War, the West treated its military like a cost it could cut — defense spending as a share of the economy slowly fell, ammunition plants shut down, production lines shrank, because everyone believed big wars between nations were a thing of the past. Then the war in Ukraine, tensions in the Middle East, and the standoff between great powers erased that belief in just a few years.
The result is what you could call a "rearmament super-cycle" — a decade-long cycle of rising defense budgets. In 2025, global military spending hit a record of about $2.89 trillion, its 11th straight year of increase, pushing military spending to 2.5% of world GDP, the highest since 2009. And the key shift is in the center of gravity — Europe accelerated its budget +14% to $864 billion in a single year, offsetting a US side that's starting to slow.
Behind this number isn't one war but a great-power rivalry that's here to stay — which means demand doesn't arrive and vanish; it becomes a multi-year "backlog" of locked-in orders. And that's what makes this industry's revenue unusually certain, no matter how any single war ends. From here, we'll "unroll the map" to show what the whole industry is built from.
02The map: what are the 10 categories
The defense industry isn't one block — it splits into 10 categories, grouped into 4 "layers" by their position in the chain, from upstream raw materials to the software that commands the fight. Each category has its own deep-dive lesson (tap to read):
Platform layer — the big integrators (primes) & infantry gear
- Defense Primes — United States: the big US system integrators selling into a $1-trillion defense budget — fighter jets, missiles, sensors, vehicles (LMT, RTX, NOC, GD, LHX)
- Defense Primes — Europe & Asia: integrators outside the US riding Europe's rearmament wave and Asia's export boom (Korea/Japan) — a different driver from the US side (Rheinmetall, BAE, Leonardo, Hanwha)
- Naval Systems & Shipbuilding: builders of submarines, surface warships, and propulsion systems — capital-heavy, with the bottleneck in a limited number of "shipyards" (HII, GD)
- Soldier Systems & Protective Equipment: the gear infantry wear — body armor, helmets, night-vision, and personal comms. Treats each soldier as a "platform" to fully kit out. A ~$10.9 billion market in 2025, growing from modernization programs worldwide (Avon Protection, Elbit, Safran · IVAS, taken over by Anduril)
Upstream layer — the chain's chokepoints
- Missiles, Munitions & Energetics 📘: missiles, guided munitions, artillery shells, and the upstream "explosives/propellants" — the scarcest point in the chain deep-dive lesson already live
- Defense Electronics, EW & Sensors: radar, electronic warfare (EW), secure comms, and ISR sensors — the "brain and senses" embedded in every platform (Elbit, Hensoldt, Mercury)
- Sovereign Supply — Minerals & Reshoring Industrials: the security-grade raw-material base — rare-earth magnets, titanium, superalloys — pulling production back home to drop reliance on China (MP, ATI, Howmet)
New platform layer — the next-gen battlefield
- Autonomous Systems & Counter-Drone: military unmanned systems (strike drones, fighters that pair with crewed jets) and counter-drone — the fastest-growing category, straight out of the lessons of the Ukraine war (AVAV, Kratos · the leader, Anduril, is still private)
- Space Defense & Missile Warning: the "defense" part of space — missile-warning satellites, military comms, and the Golden Dome architecture (Rocket Lab, Kratos, LMT)
Services & software layer — the sticky revenue
- Defense Software & C4ISR: mission software, AI-enabled command-and-control (C2) systems, and security-cleared government IT services — recurring contract revenue, high margins (Palantir, Leidos, Booz Allen)
03How it all connects (the defense chain)
The best way to understand this industry is to see it as a chain handed off step by step — security-grade raw materials and electronics from upstream flow into the big integrators (primes) that build the actual platforms (aircraft, ships, missiles). Then newer layers like space and unmanned systems build on top, and everything is strung together by the command software that sits at the very top. Here's the whole picture:
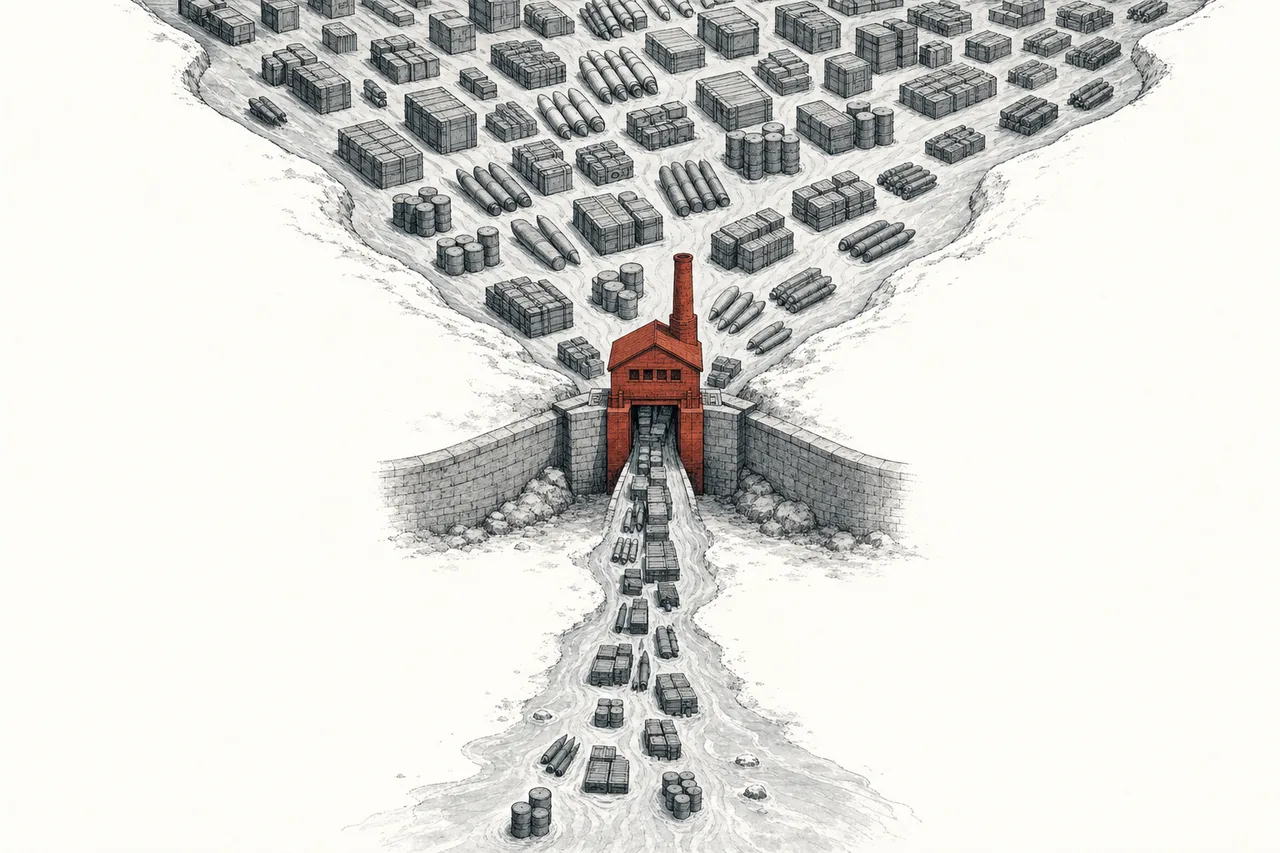
The most interesting part is the rarely-discussed "bottlenecks" in the upstream layer. When we think of defense, we picture fighter jets or submarines. But the truth is, how fast primes can build a platform depends on whether enough munitions, propellant, electronics chips, and rare-earth magnets are feeding them. And these are the points where very few companies can deliver — propellant, say, and explosives like TNT, where Europe has only a single production source left. That's exactly why every country is racing to build its own capacity.
04Where the value and power sit
There's a common misconception — people tend to think the "big integrators" (primes) like Lockheed or Rheinmetall are the obvious winners, because they land the giant, headline-making contracts. But the reality is more complicated. Primes hit a "capacity ceiling" — the budget comes in, but they can only build submarines or aircraft as fast as the shipyards and production lines allow. So their margins get squeezed.
The real pricing power piles up instead at the upstream "bottlenecks" and the layers that are re-rating — wherever supply is short and few companies can deliver, that's where the bargaining power is highest:
This explains why the munitions and propellant category is more interesting than it looks — when every country has to refill the ammunition stockpiles they burned through in Ukraine all at once, but propellant and TNT come from only a few sources, whoever controls the upstream sets the price. Meanwhile command software (C4ISR) has a different kind of appeal — its revenue is "sticky" recurring contracts that are hard to switch out of, with high margins, and it isn't capped by a factory ceiling the way building real hardware is.
The lesson for reading this trend: don't just ask "is this company in defense?" — ask "is it sitting at a bottleneck where supply is short, or at a capacity ceiling?"
05The forces that hit the whole trend
Even though each category differs, three big forces move the whole industry at once:
1. Geopolitical fragmentation — this is the root of everything. When trust between nations fades, each one no longer wants to rely on a rival's supply chain, so it races to build its "own supply" — ammunition plants, rare-earth magnets, titanium. This ties the trend directly to Critical Materials — war doesn't just push budgets up, it pushes "reshoring" of production across the whole chain.
2. The rearmament wave in Europe and Asia — the biggest force in dollar terms. In June 2025, NATO nations made a historic pledge to push defense budgets to 5% of GDP by 2035 (split into 3.5% for core defense + 1.5% for related security), up from a target of just 2% — a leap in the target. Meanwhile in Asia, South Korea has become a new arms-export power, and Japan has started raising its defense budget for the first time in decades.

3. The shift to autonomous systems and software — the Ukraine war proved that cheap drones in large numbers ("attritable mass" — things you can afford to lose) can really change the battlefield. That moves demand from a few expensive platforms toward many unmanned systems + AI-commanding software. This shift opens the door for new players like Anduril and Palantir to challenge the legacy primes, and ties this trend deeply to AI.

06Where we are now + the champion of each category
2025–2026 is the era of orders piling up beyond capacity — the whole industry's backlog is setting records all at once. RTX has a backlog of ~$271 billion (the largest in the industry). Europe's Rheinmetall has a backlog of ~€73 billion and expects sales to grow 40–45% in a single year. Korea's "Big Four" together have a backlog of over $72 billion. Below are the "champions" of each category, reflecting how the power is spread across the US, Europe, Korea, Israel, and new players:
07The future and the risks
Looking ahead, this trend has unusually strong structural tailwinds — multi-year locked-in backlog and political commitments (NATO's 5%) make its revenue more predictable than most industries. But there are risks you have to watch as a pair.
On the opportunity side: new battlefields are expanding fast — the Pentagon is requesting over $54 billion for autonomous systems in FY2027 and plans to procure hundreds of thousands of drones, while the "Golden Dome" architecture to defend against long-range missiles is becoming a hundred-billion-dollar program. Whoever controls the upstream bottlenecks (munitions, propellant, magnets, electronics) or stands in these new layers holds strong leverage.
On the risk side, there are three layers to watch:
- Politics and budgets: defense spending depends on politics — budget fights, continuing-resolution delays, or cuts to save money all hit the rhythm of revenue. The NATO 5% pledge itself still has to prove each nation can actually deliver on the timeline
- Cycles and market sentiment: these stocks have run ahead of fundamentals before — even with record backlog, some European names like Rheinmetall have pulled back hard (−39% over 14 months) when expectations got ahead of themselves. The raw-materials category (minerals/magnets) also has the up-and-down nature of a commodity
- ESG and ethics: this is the most sensitive category for sustainable investing — many ESG funds exclude the weapons industry, making the investor base narrower and the volatility higher. That view is shifting in Europe (which has started seeing defense as "preventive security"), but it's still a policy risk to weigh
And that's why this chapter is a "map," not a "deep-dive guide" — because the real value of seeing the whole trend is seeing that all the pieces string together as one story before you walk in to explore each room in detail — just tap into the deep-dive chapter of whichever category interests you.