Megatrend · whole-trend overview
Wiring a nervous system into the city — so where's the real money?
The "smart city" in the brochure is self-driving cars, traffic lights that think for themselves, and giant glowing screens — but a lot of those projects flopped badly. The reality is far more boring: the real value is in putting sensors on, wiring up communications, and adding an automated brain to infrastructure that already exists — electricity meters, office buildings, the power grid, roads. This lesson is the map that strings the 6 categories together — how they stack into "layers," and why the money piles up with unglamorous automation companies, not the showcase cities in the news (each category has its own deep-dive chapter).
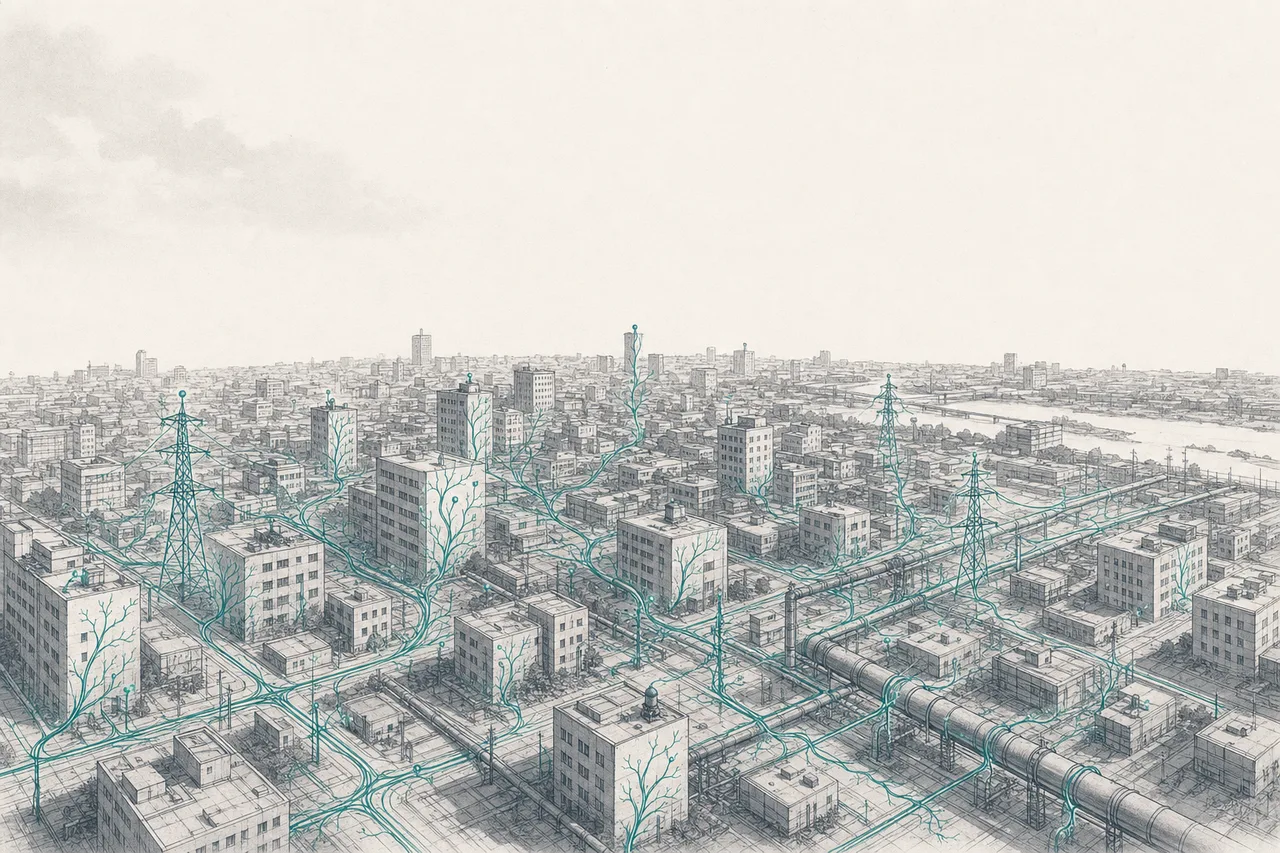
01The big picture: a city being fitted with sensors
Think of the electricity meter outside your house. It used to be that someone walked by once a month to read the number. Today it sends your usage back to the utility every few minutes, on its own. That's the heart of this trend — taking the physical infrastructure that used to be "dumb," putting sensors on it, wiring up communications, and giving it a brain that can decide for itself — from power lines to buildings to roads to delivery trucks.
The key thing: this trend isn't about AI or chips (that's the AI and semiconductors story) — it's about the boring hardware embedded in the city, going digital one piece at a time. And it's a very big market, even though the "smart city" figures swing wildly by who's defining them (from ~$700 billion to nearly $1 trillion in 2024–25, and projected to top $1.4–3.8 trillion by 2030):
But before you get excited about the numbers, here's one truth worth saying first: the term "smart city" mixes the real thing with a lot of overhype. Many of the showcase cities in the news flopped badly (we'll get to that). The real value isn't in flashy new cities — it's in upgrading what already exists, one layer at a time. That's what we're going to lay out on the map.
02The map: 6 categories in 4 layers
The best way to understand this trend is to see it as "stacked layers," like the nervous system of a living thing — from the nerve endings that sense, up to the brain that gives orders. All 6 sub-categories sit in one layer or another, and each has its own deep-dive lesson (tap to read):
Layer 1 — nerve endings (sensors & IoT at the base)
- Smart Metering & Grid Edge: smart meters and devices at the grid edge — the "nerve endings" that measure electricity, water, and gas use in real time, the data foundation for the whole system
Layer 2 — nerves & platforms (move the data + make it visible)
- Connected Fleet & Telematics: sensor boxes in vehicles and transport fleets that send back location and driving behavior — infrastructure that "moves"
- Geospatial, BIM & Urban Digital Twin: 3D maps and a "digital twin" of the city — where data from every sensor comes together into one picture people can understand and simulate
Layer 3 — the commanding brain (automation applications)
- Intelligent Traffic & Tolling Systems: traffic lights that adjust to real traffic, automatic toll collection — using road data to make cars flow better
- Smart Buildings & Connected Lighting: automated building control systems (HVAC, lighting, security) — the category that makes the most real money, because the energy savings are huge
- Urban Public Safety & Surveillance: CCTV cameras, alert systems, and city command centers — powerful, but the most sensitive category when it comes to privacy
03How it connects (the city's stack)
The heart of this map is the word "stack" (layers piled on each other) — data flows up from the sensors at the base, through the communications and the digital-twin platform, up to the applications at the top that make decisions. Then commands flow down to operate the devices at the base. It's like a nervous system: sense → send the signal → the brain thinks → command the muscles.
This relationship carries an important lesson: the lower layers are cost, the upper layers are value. Anyone can sell cheap sensors (a commodity, fighting a price war). But the one who takes all that data and "cuts a building's power bill by 30%" or "makes the city's traffic flow better" — that's who gets paid well, because that's the result customers will pay for.
04Where the real money piles up
The most important question in this trend is — across the whole stack, "who actually makes the money"? And the answer might surprise a lot of people: not the flashy smart-city startups, but the boring industrial-automation giants that own the building and grid app layer — Schneider Electric, Siemens, Honeywell, Johnson Controls.
The reason is that the building and grid app layer is the city's "picks and shovels" — no matter how a city gets "smart," every building needs an energy-saving HVAC control system, and every utility needs a grid-management system. So the companies selling these get paid for sure. A clear example: Johnson Controls posts around $5.7 billion in a single quarter (Q2 FY2025), most of it from building systems, while Schneider Electric brings in about $40 billion a year from energy management and automation.
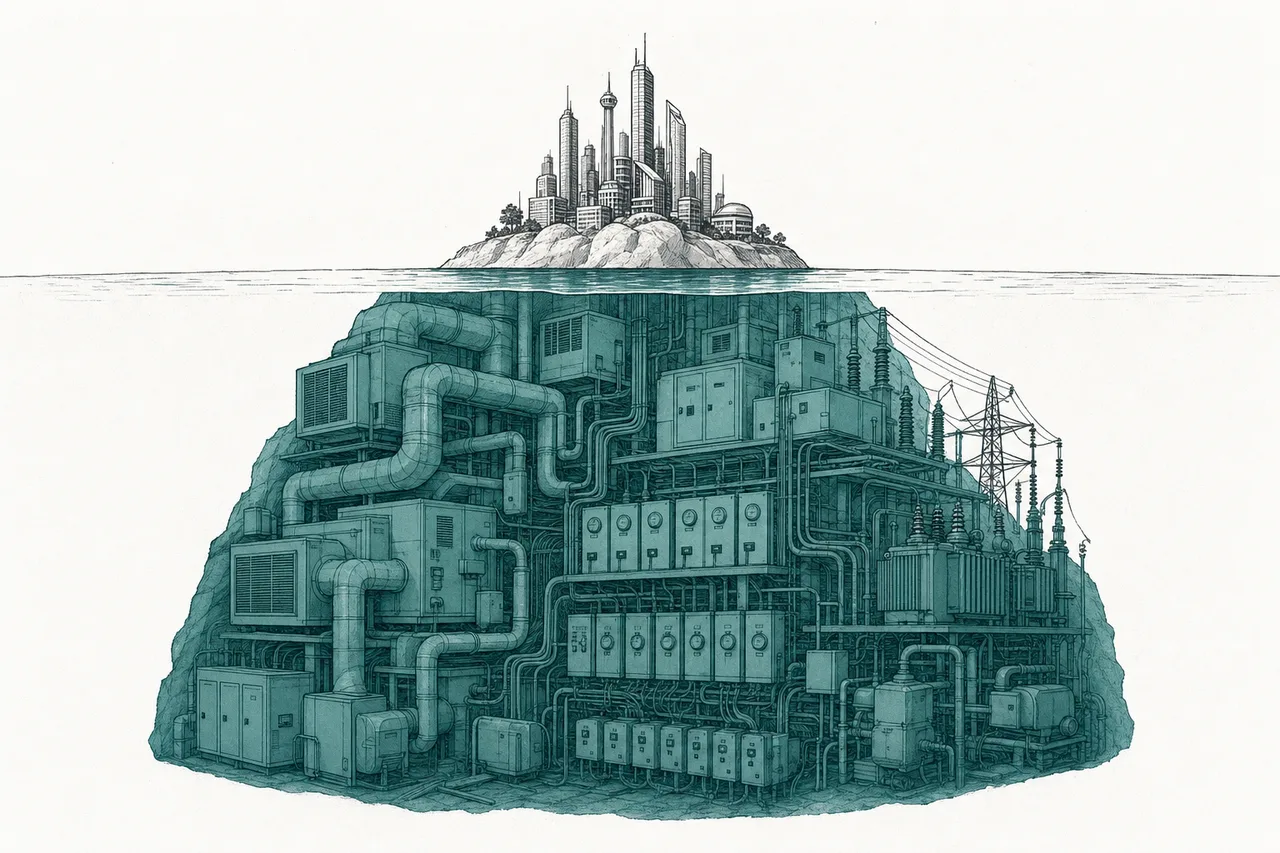
The lesson for reading this trend: don't just ask "does this company do smart cities?" — ask "is it selling a result customers pay for again and again (saved energy, less downtime), or just selling a pretty vision?" The first is a business, the second is a news story.
05Forces that move the whole trend
Even though each category has its own story, four big forces move the whole trend at once:
1. The sensor wave (IoT) — the base of everything is the number of devices connected to the internet, surging from ~21.1 billion in 2025 toward ~40 billion by 2030. The more sensors there are, the denser the data, and the smarter the upper layers get.
2. AI moves in as the decision layer — sensors give the data, but AI is what turns raw data into decisions (traffic lights tune themselves, buildings predict power use, the grid balances supply). This trend leans on AI — without a brain, the data is just a giant pile of numbers.
3. The energy transition & grid modernization — as the world shifts to clean energy and EVs, the old grid can't keep up. It has to get "smarter" to handle power that flows two ways (a house with solar can sell power back). This is the force pushing smart grids and smart meters directly.
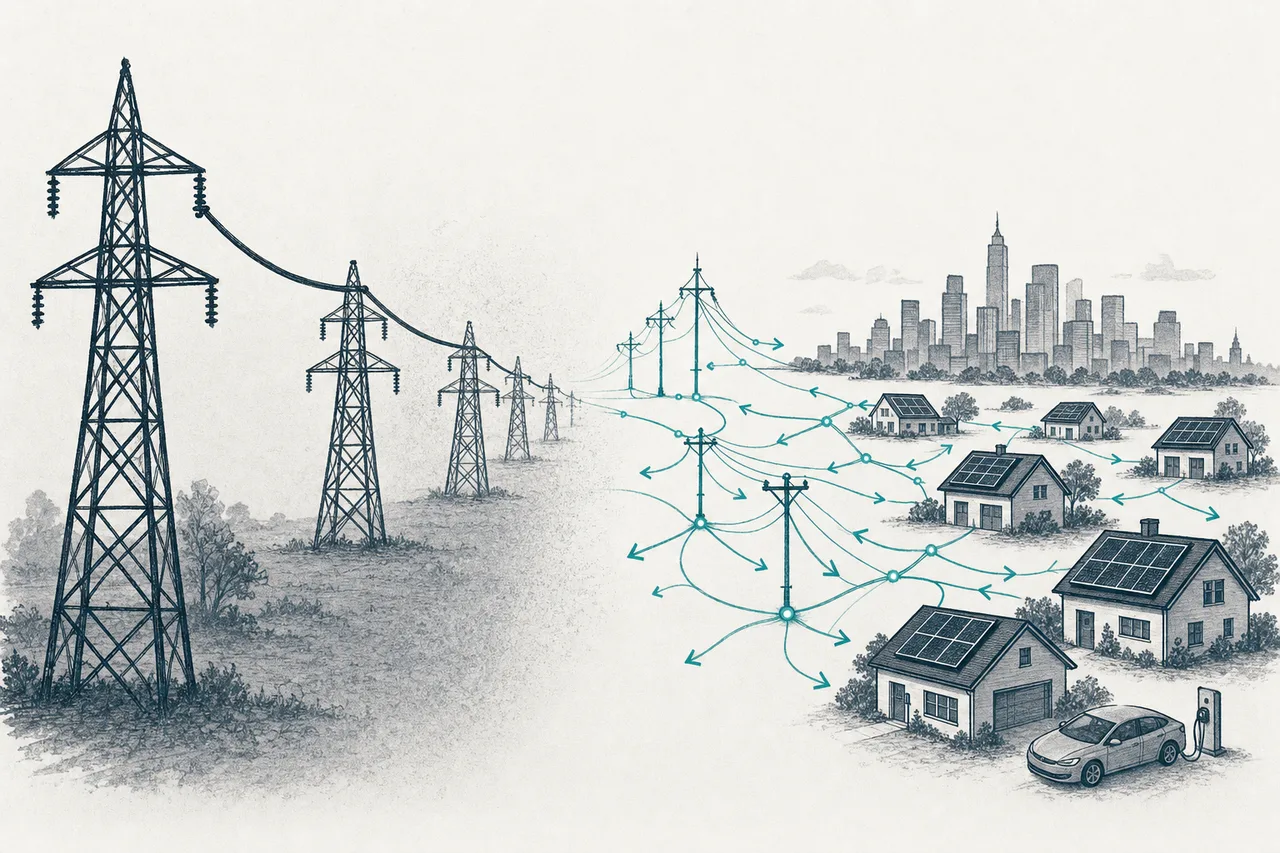
4. Retrofit mandates & denser cities — many countries' building codes now require old buildings to cut their energy use (a retrofit mandate), and on top of that, more and more people keep moving into cities, so the existing infrastructure can't carry the load. Both forces push to upgrade what's already there to make it smart — and that's the heart of this whole trend.
06Where it stands now + the champion of each category
In 2025–2026, this trend is in an "emerging" state — the real thing is being installed one layer at a time, quietly, in buildings and power grids around the world. Not flashy, but growing steadily. The standout feature: the power is concentrated in the European/US automation giants that have been in the industry for a hundred years, not startups. Below are the "champions" of each category:
07The future, and the risks (including the overhyped parts)
No honest lesson on smart cities can skip this — most of "smart city" is overhype. The most famous case is Google's Sidewalk Labs, which was going to build a $1.3 billion showcase city on Toronto's waterfront — self-driving cars, heated sidewalks, underground robots collecting trash — and in the end the whole project collapsed in 2020 over privacy problems and public opposition. That's an important lesson: the flashy showcase cities in the news are usually not where the real business happens.
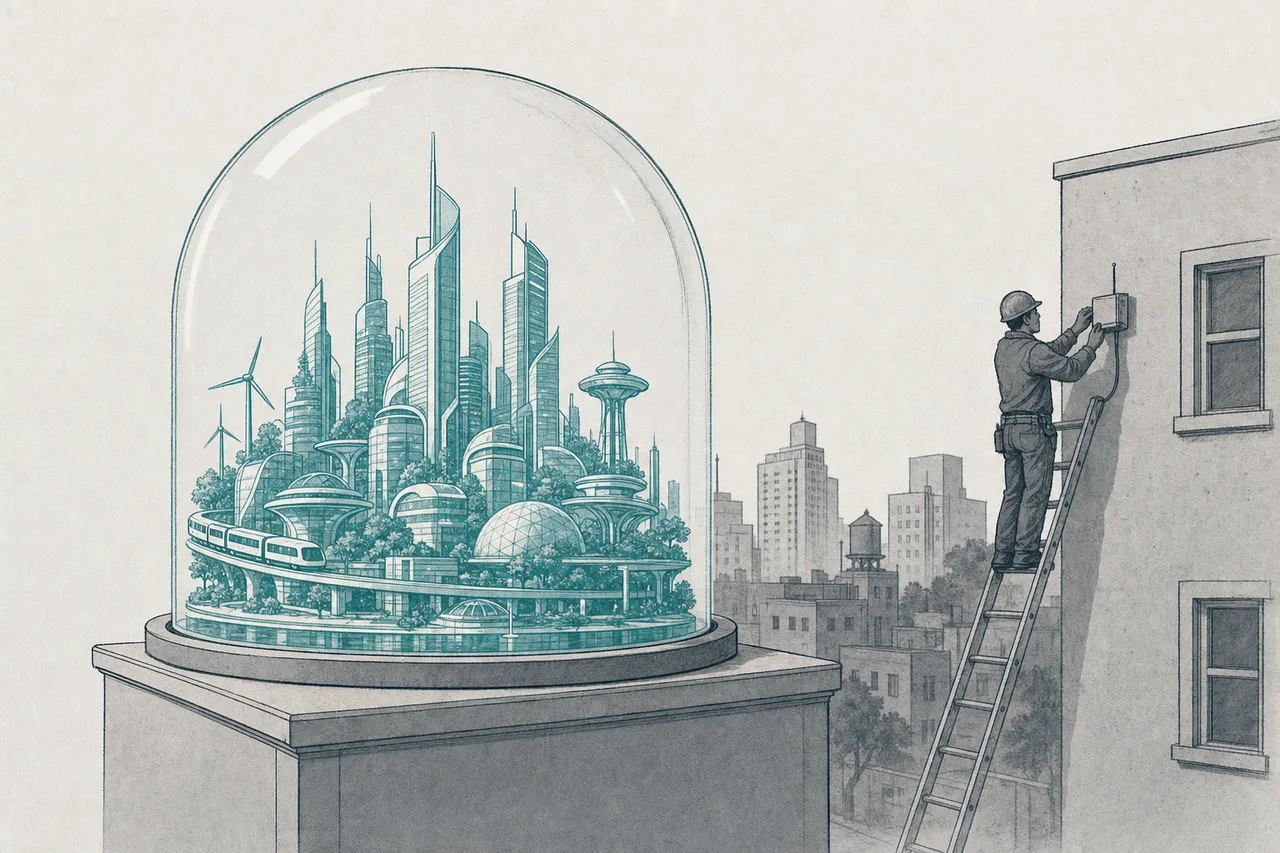
On the opportunity side: the "boring but real" part keeps growing strongly — the smart-buildings market is seen reaching ~$191 billion by 2030 (CAGR ~13%), and smart grids and digital twins are growing double-digits too. The tailwinds are energy-saving laws, the energy transition, and denser cities — all structural forces that don't disappear easily.
On the risk side, there are three layers to watch:
- The long public-sector sales cycle: this trend's big customers are municipalities and governments, where budgets are slow, procurement drags on for years, and direction shifts with politics — a big deal can be stuck for a very long time
- Hype: "smart city" is an easy term to sell with, so you get projects that look good on a slide but never make money. Investors have to separate "automation that actually cuts the power bill" from "a future-city vision"
- Privacy & cybersecurity: the more sensors and cameras a city installs, the more of an attack target — and a flashpoint over surveillance — it becomes (the Toronto case collapsed over exactly this), which ties this trend inseparably to cybersecurity
In short: this trend is the not-sexy-but-it-makes-money story — it's not a sci-fi-movie city, but meters, buildings, and power lines getting smarter one piece at a time. Anyone who understands that the value piles up in boring automation, not flashy visions, will get this trend — just tap into the deep-dive chapter of whichever category interests you.