Megatrend · Whole-trend overview
A world hungry for power: the energy map for an era when electricity demand is surging again
For the first time in nearly 20 years, global electricity demand is “growing strongly” again — and this time the driver isn't just homes and factories. It's AI data centers that draw as much power as an entire country, plus the electrification of cars and factories. This node is the map that ties all 11 energy categories together — following the path electricity takes as it's generated → transmitted → stored → used: who makes the power, who controls the grid, where the bottlenecks are, and where the money piles up (each category has its own deep-dive chapter to read separately).
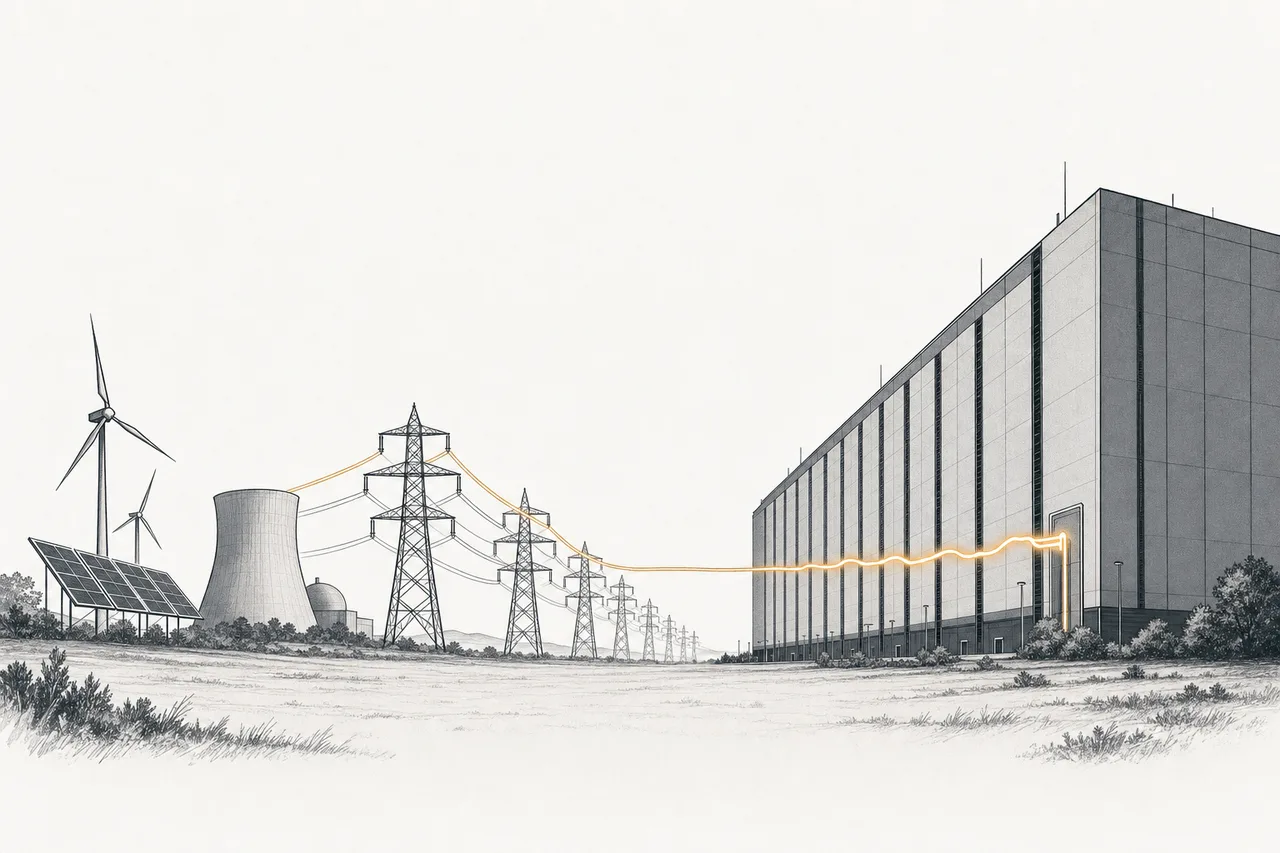
01The big picture: why electricity is the main character again
Picture it simply — in a developed country like the U.S., electricity demand barely grew for nearly 20 years, because energy-efficient appliances improved about as fast as the economy grew. Then suddenly, in 2025, demand “surged back.” The main cause was one thing: power-hungry AI data centers, plus the electrification of cars and factories, and the reshoring of manufacturing.
This isn't a small story. The IEA estimates that data centers worldwide used about 415 TWh in 2024, rising to nearly 945 TWh by 2030 — more than all of Japan uses today. That's roughly 15% growth a year, four times faster than every other electricity sector combined. In the U.S. alone, data-center load could hit 176 GW by 2035, about 5 times the 2024 level.
And the money follows the demand. Global investment in the “energy transition” hit a record $2.3 trillion in 2025, up 8% from the year before, and BloombergNEF expects it to average about $2.9 trillion a year over the next 5 years. Money on that scale can move the whole world economy — but to really understand it, you have to see energy as “the journey of electricity,” from where it's born all the way to your outlet.
This megatrend looks at energy from the “generate-and-deliver” side (the supply side) that has to meet electricity demand from AI and electrification — covering low-carbon generation plus power you can run any time (firm power), the grid, and storage. It does not include the user side of EVs (that's in the Electrification & Mobility trend) or pulling CO2 from the air (Carbon Removal).
02The map: what the 11 sub-categories are
The best way to understand energy is to follow “the path of electricity” — where it's generated, how it's transmitted, when it's stored, and who uses it. This trend's 11 sub-categories break into 4 stages along that path (each category has its own deep-dive lesson — tap in to read it):
Stage 1 — Generation
- Nuclear Generation & Utilities: large nuclear plants that run 24 hours a day — becoming the “go-to choice” for AI giants who need carbon-free baseload power
- Advanced Nuclear — SMR & Microreactor: small next-gen reactors (SMRs) not yet in commercial production — a long-term bet that runs on milestones
- Solar: utility-scale and rooftop solar — the cheapest, fastest-growing power source in the world
- Wind: onshore and offshore turbines — onshore is recovering, offshore is still losing money
- Geothermal & Firm Renewables: geothermal — renewable power you can run 24/7 (firm), independent of sun and wind
- Hydropower & Pumped Storage: hydropower and pumped storage — both baseload generation and grid-balancing
- Firm Power & Transition Fuels: power you can dispatch on command — natural gas as the “bridge,” plus on-site generation
- Hydrogen & Fuel Cells: hydrogen and fuel cells — an energy carrier still leaning on policy, most of it not yet profitable
Stage 2 — Upstream fuel (Fuel Cycle)
- Nuclear Fuel Cycle (Uranium & Enrichment): uranium mining and enrichment — the fuel that feeds every reactor (tied to Critical Materials)
Stage 3 — Transmission (Grid & Transmission)
- Grid, Transmission & Power Equipment ★: power lines, transformers, switchgear, and the contractors — the heaviest bottleneck right now and the place with the most pricing power
Stage 4 — Storage
- Energy Storage & Grid Flexibility: grid-scale batteries and energy-management software — they store surplus power when the sun is strong or the wind is blowing, then release it when the grid is tight (car batteries are in the Electrification trend)
03How it all connects (electricity's journey from source to outlet)
The heart of this map is “the journey of the electron” — electricity is born at a diverse set of sources (nuclear, solar, wind, hydro, gas), and all of it must first flow through the grid/transmission. Some of it gets stored in batteries, smoothing power that arrives in bursts (sun/wind) into power that can be delivered steadily. Then, finally, it reaches the hungriest end point — AI data centers and electrification.
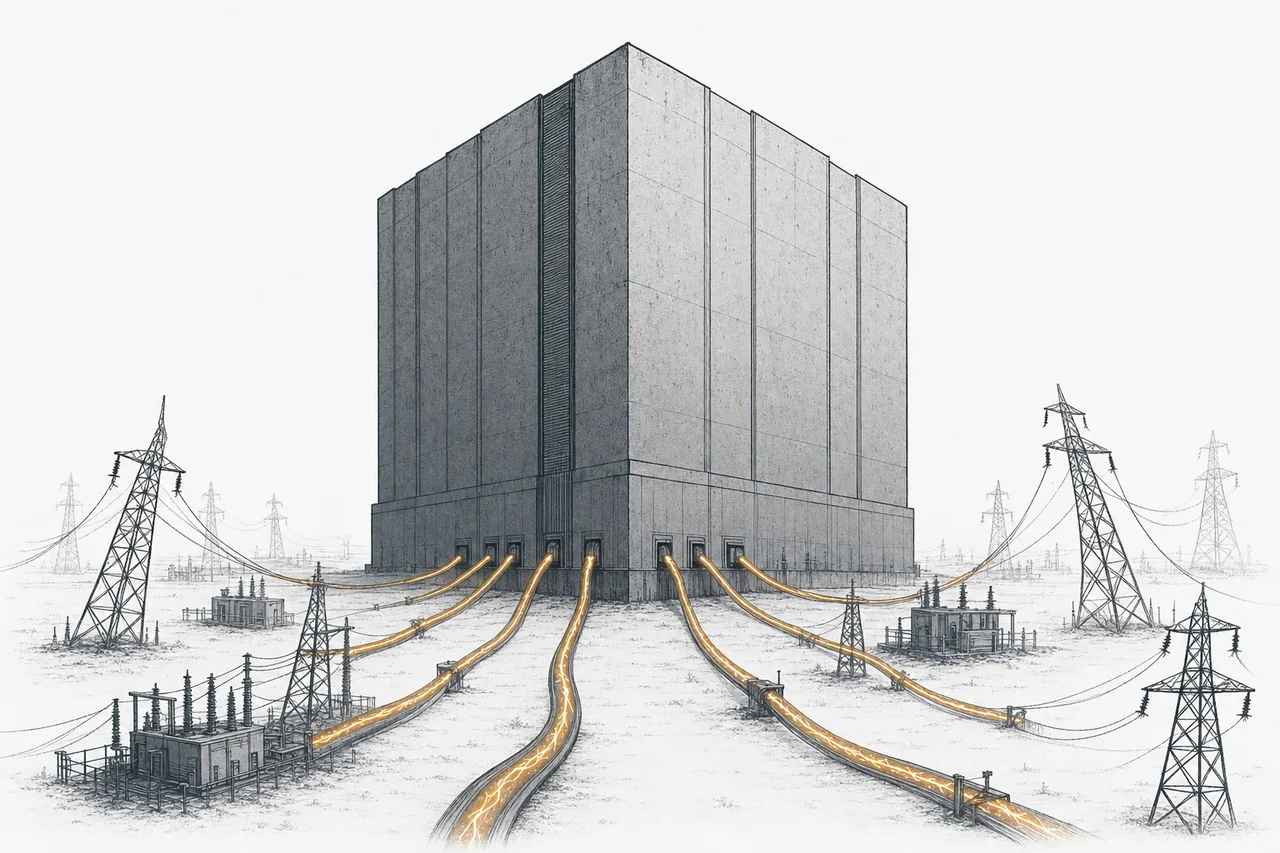
The most interesting part is that “the bottleneck is in transmission, not generation” — the world keeps making clean power cheaper and in bigger volumes, yet it can't deliver it fast enough because transformers and power lines are badly short. Transformer demand has surged 116% since 2019, pushing wait times for some models to 128–144 weeks (almost 2.5–3 years). The result: lots of finished clean-power projects that can't connect to the grid — and the IEA estimates that about 20% of planned data centers could be delayed while they wait for a grid connection.
04Where the value and power sit
The key rule of this trend is that value and profit pile up at “the point of scarcity” — not where anyone can do it. And the scarcest point right now isn't “generating power,” it's the equipment that delivers power (the grid) and baseload power you can run any time (firm power).
The most powerful position is the grid and transformers — scarce, with long queues, so makers can raise prices (transformer prices are up about 77% since 2019). It's also a bottleneck tied to special raw materials like grain-oriented steel, which has only a few producers. Next comes carbon-free baseload, especially nuclear that runs 24/7 — it became valuable the moment AI giants started signing 20-year contracts to lock in power ahead of time.
On the flip side, solar panels, even though they're the cheapest and fastest-growing, are a “commodity” that anyone can make (especially supply from China). So they get dragged into a price war with thin margins — a classic example that “grows fast” and “makes good money” are two different things.
The lesson for looking at this trend: don't just ask “is this company in clean energy?” — ask “is it standing at the bottleneck (grid/baseload), or is it in the middle of a price war (commodity)?”
05Forces that move the whole trend
Even though each category has its own story, there are 3 big forces that move the entire energy trend at once:
1. The AI demand wave — this is the force that changed the game, pushing long-flat electricity demand back into strong growth. AI giants don't wait — they rush to sign long-term power-purchase agreements (PPAs) to “lock in” electricity first, especially with nuclear, because it's carbon-free power available any time. This demand ties energy deeply to AI, to the point that “electricity” has become the bottleneck for scaling AI.
2. The falling cost of clean energy — solar and batteries got cheap enough to change the game. In 2025, battery prices fell about 30% in a single year, a record low. That made “solar + battery” competitive with gas plants in many markets. BloombergNEF forecasts renewable capacity will grow 84% over the next 5 years, with solar becoming the world's largest power source by 2032.
3. Policy and geopolitics — energy is a matter of state. Subsidies, import tariffs, and reshoring the supply chain directly shape costs and winners. From China's dominance of solar-panel and battery manufacturing, to a new wave of pro-nuclear policy, to dependence on critical materials (copper, lithium, uranium) concentrated in a handful of countries — these are risks that don't show up in the financial statements, but on the world map.
06Where things stand now + each category's champion
2025–2026 is the era when money pours into the whole system at once — AI demand strains every stage, from transformers with multi-year queues to AI giants rushing to reserve nuclear power (there are currently at least 13 nuclear–data-center deals, totaling over 9.8 GW). Below are the “champions” of each stage, reflecting how the power is spread across many countries and many energy sources:
07The future and the risks
Looking ahead, this trend has both tailwinds and risks that you need to watch together.
On the opportunity side: power demand looks strong and spread across every category — in the U.S., electricity demand could grow 17% by 2030 (and 23–25% if data centers get built as planned). The clean side is growing strongly too: renewables will supply 67% of the world's electricity by 2050 (up from 33% in 2024). And above all, the grid needs huge investment — the IEA says the world needs to add or upgrade over 80 million km of power lines (equal to the entire grid that exists worldwide today), and grid investment must double to over $600 billion a year — whoever controls these bottlenecks holds strong leverage.
On the risk side, there are three layers to watch:
- Grid and supply-chain bottlenecks: power can be made but not delivered in time — transformers queued for years, shortages of special materials, and grid connections that can't keep up. That can turn good projects into stranded assets
- Leaning too hard on the AI-demand assumption: if AI investment slows or overbuilds, the expected power demand may not show up on schedule — leaving long-term PPAs and pre-built capacity as a burden
- Policy swings and geopolitics: subsidies, import tariffs, and supply-chain concentration (China dominating solar/battery; uranium and copper in a few countries) can flip costs and winners quickly with politics
And that's why this chapter is a “map,” not a “deep-dive guide” — the real value of looking at the whole trend is seeing that every unit of electricity travels from source to outlet through the same system. Once you get that, you can go explore each room in detail — just tap into the deep-dive chapter of whichever category interests you.